


 How Donald Trump has changed the way diplomacy is done
  Morgan Stanley Sees Chinese Auto Market Recovery Gaining Momentum in Late Summer
  Sell the Bounce": Gold Rally Stalls Near $4165 as Fed Hawks Slam the Door on Rate Cuts — Targets $4000/$3600
  World Cup technology: from ref cams to AI analysts, cutting-edge research is changing the game
  Gold's 365-Day EMA Streak Since Oct 2023 Faces Its First Real Test at $3,980 — Break or Bounce to $4,140?
  With Iran and the US signing a peace deal, where does that leave Benjamin Netanyahu?
  Trump’s Iran Strategy: What Has Been Achieved After Three Months of Conflict?
  Goldman Sachs: US Dollar Likely to Stay Strong Despite Oil Price Retreat
  Silver Cracks Key 365-Day EMA for First Time Since Feb 2024; Bears Eye $50 on Rallies
  SpaceX Stock Gets $175 Target as Analysts See Massive Growth Ahead


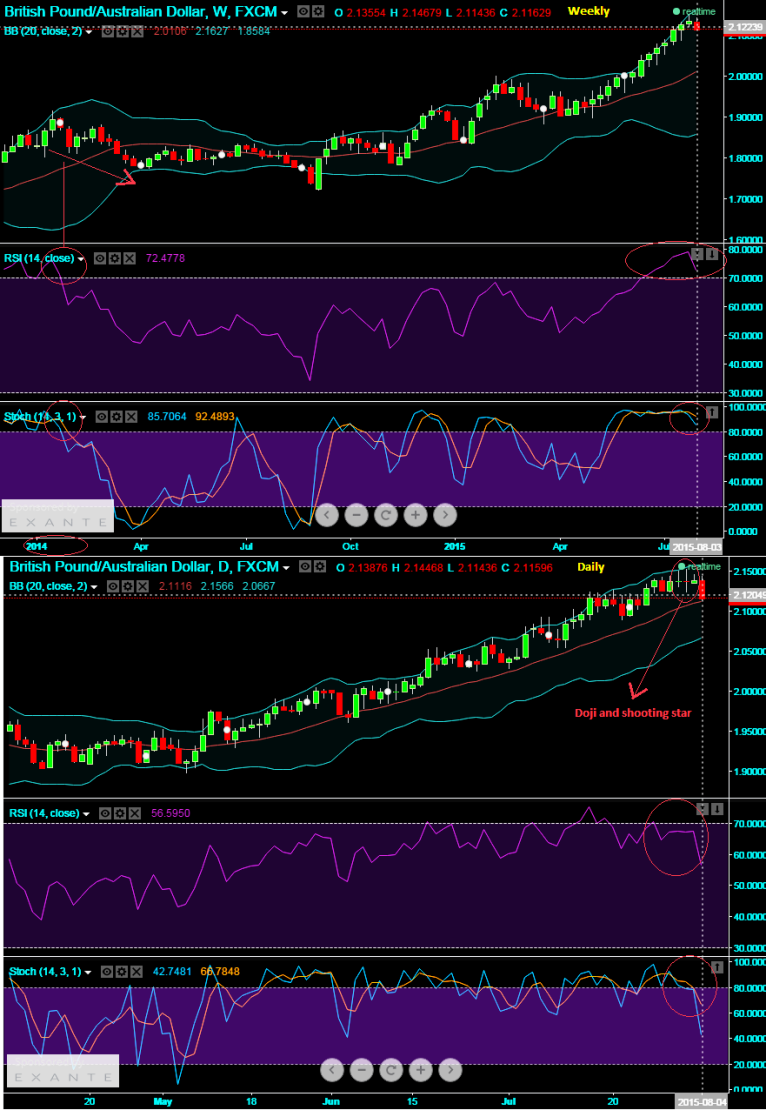
We spotted out a clear sell call on this pair 1st time ever since February 2014. Why we are calling this as clear sell is that we often urge technical should not studied in an isolation as a particular signal should be precisely justified and substantiated in enough confirmation with other indicators, trend or whatsoever.
While we were designing long term hedging framework 14 week RSI was used with an objective to track price momentum over medium to long term perspectives. As shown in the diagram, when strength index curve approached 80 levels (i.e. overbought territory) a steep divergence is evidenced around 2.1467 levels. Divergence on weekly often takes many weeks to correct these price discrepancies. For a swing trader it is all too easy to be carried away by a market that apparently knows no bounds.
Slow stochastic on the other hand also evidences overbought scene as %D line crossover above 80 levels which is again overbought zone. The same was confirmed with daily charts as both leading oscillators evidence the same situation and substantiated better with some bearish candles such as Doji and shooting star patterns at 2.1376, 2.1378 and 2.1387 respectively. Currently on weekly charts, RSI is trending at 72.2698, %D line at 92.5050 while %K line at 85.8124 levels.
On hedging grounds, 1M At the money -0.47 delta puts are recommended in debit spreads combining with in the money puts of 7D maturity. But on speculating grounds, buy digital vega puts for targets of 15-20 pips.

- News

- Economy

- Central Banks
- Investing
- Research
- Roundups
- Digital Currency
- Insights
- Technical Analysis
- Technology
- Business
- Law
- Health
- Nature
- Fintech
- Science
- Topic
- Opinions
- ©Econometrics LLC . All Rights Reserved.
FxWirePro: Weekly RSI indicates short GBP/AUD first time since Feb 2014; prefer vega puts for hedging and speculating
Tuesday, August 4, 2015 7:00 AM UTC
Editor's Picks


- Market Data
Most Popular


