


 Oil Prices Dip Slightly Amid Focus on Russian Sanctions and U.S. Inflation Data
  OECD Sees Bank of Japan Raising Interest Rates to 2% by 2027
  Bank of America Posts Strong Q4 2024 Results, Shares Rise
  Gold Prices Slide as Rate Cut Prospects Diminish; Copper Gains on China Stimulus Hopes
  BOJ Governor Kazuo Ueda Hints at Rate Hike as Inflation Pressures Build
  Japan Inflation Expectations Rise as BOJ Rate Hike Timing Faces Uncertainty
  DOJ Ends Probe Into Fed Chair Jerome Powell, Boosting Kevin Warsh Confirmation Prospects
  Wall Street Analysts Weigh in on Latest NFP Data
  Goldman Predicts 50% Odds of 10% U.S. Tariff on Copper by Q1 Close
  Kevin Warsh Advances Toward Fed Chair Role Amid Political Tensions
  AI-Driven Inflation Raises U.S. Consumer Prices, Goldman Sachs Says


Within next fortnight or so, we have series of monetary policy meetings lined up. A very low supply of economic surprises currently is by itself enough to explain the low level of market volatility.
RBA’s cash rate today is unchanged at 1.50%
ECB’s minimum bid rate on June 8th.
Federal Reserve of US on June 14th.
SNB’s LIBOR rate on June 15th.
BoE’s monetary policy summary and bank rates on June 15th.
BoJ’s monetary policy rate on June 16th.
Market volatility, both realized and implied, has declined across all asset classes this year, returning to the historical low seen during the middle of 2014. Despite its currently low level, market volatility is thus far from unprecedented
We proxy economic surprises by the standard deviation of weekly changes in J.P. Morgan's Forecast Revision Index (FRI) for global real GDP growth.
The current level of 3-month implied volatility across five asset classes is very much in line with our economic surprise proxy.
Leverage also matters for market volatility. We tend to think of market volatility as the product of the supply of surprises (news) and the vulnerability of markets to these surprises (leverage).
In terms of leverage, potential vulnerabilities lie with individual equity investors in the US, the leverage of which rose back to the historical highs seen in the middle of 2015, and non-financial corporates in China, the leverage of which remains stubbornly high.
The retrenchment of active managers, who are being crowded out by central bank QE in the bond space and a shift towards ETFs in the equity space, acts as the long-term depressant of market volatility.
Equally important as a long-term depressant of market volatility is a persistently high amount of excess cash balances by non-bank investors globally, which in our opinion backstops both equities and bonds and reduces downside volatility.
What is causing the decline in volatility? In our previous work “Volatility, Leverage and Returns”, it has been thought of market volatility as the product of the supply of surprises (news) and the vulnerability of markets to these surprises (leverage).
For example, an unexpected central bank policy change (the “surprise”) can change bond and equity prices by raising the expected path for growth and/or inflation. The actual price move and, thus, volatility are driven by the degree to which this policy news affects inflation and growth expectations, as well as uncertainty (i.e. the vulnerability or sensitivity of asset prices to the surprise).
This sensitivity should be driven by the degree to which the surprises induce investors to change their positions, which in turn would be driven by their leverage, by their risk capital and by the cost of trading.
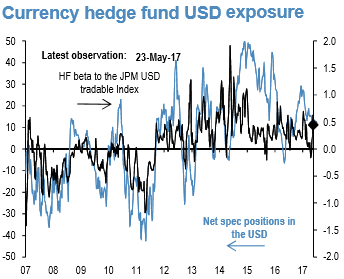
FX hedge fund USD exposure (refer above chart): The rolling 21-day beta of the Barclay Hedge FX index with the JPM USD tradable index vs. the net spec position in the USD as reported by the CFTC. Spec is the non-commercial category from the CFTC. Net spec position below is with one week’s lag.


