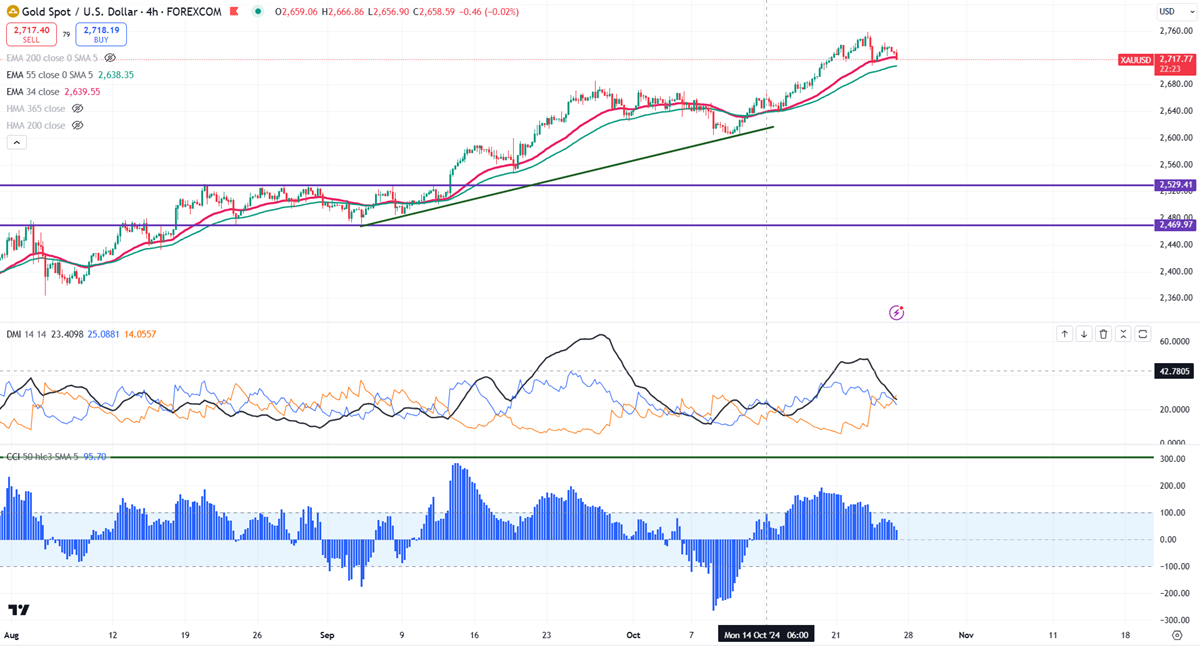
Gold has given back some of its gains following encouraging U.S. home sales data. It reached a peak of $2,743 yesterday but is now trading around $2,719 as higher yields put pressure on the market.
U.S. Economic Insights:
In September 2024, new home sales in the U.S. rose by 4.1%, reaching a seasonally adjusted annual rate of 738,000 units, the highest since May 2024.
- August Performance: In August, sales dipped by 4.7% to 716,000 units, following a significant 10.6% increase in July, which saw sales peak at 739,000 units.
Impact of Positive Economic Data:
In response to stronger economic indicators, the yield on the 10-year U.S. Treasury note climbed to about 4.18% as of October 21, 2024, marking the highest yield since late July. This shift indicates that the market is adjusting to a more optimistic economic outlook.
Technical Analysis:
Gold is currently trading above both short-term and long-term moving averages on the 4-hour chart. Immediate support lies around $2,700; if it falls below this level, targets may drop to $2,685, $2,670, $2,660, or even $2,638. A bear trend would emerge only if prices drop below $2,470. On the upside, minor resistance is seen around $2,739, and breaking this level could push prices to $2,750 and $2,775.
Current indicators show mixed signals: the Commodity Channel Index (CCI) is bullish, while the Average Directional Movement Index (ADX) suggests a neutral trend.
Trading Strategy:
Consider buying on dips near $2,700 with a stop-loss set around $2,670, aiming for a target price of $2,759.