


 FxWirePro- Major Crypto levels and bias summary
  Ethereum Cracks Under $1,700: Sell the Rally Near $1,750 as Bears Eye $1,380–$1,200
  BTC’s Bear Bounce: Sell the Rally Near $66K as Bears Target $59K–$52K Breakdown
  FxWirePro- Major Crypto levels and bias summary
  FxWirePro- Major Crypto levels and bias summary


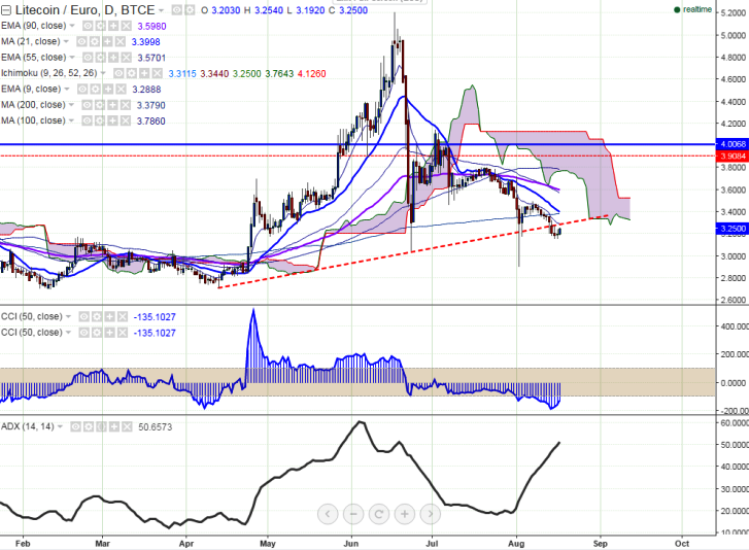
LTC/EUR is seen trading above on Wednesday after the plunge. The pair has slightly recovered from the low of 3.1570 levels (BTCE). It is currently trading around 3.250 at the time of writing.
Ichimoku analysis of daily chart shows:
Tenkan-Sen level: 3.317
Kijun-Sen level: 3.345
Trend reversal level - (90 days MA) - 3.605
Long- term trend remains to be neutral. In a daily chart, LTC/EUR is trading well below 200-day MA. So a decline till 2.90 is possible.
Major resistance is seen at 3.38 (200 days EMA) and any break above targets 3.605 (90 days EMA)/3.78 (100 day MA). Short-term support can be noticed at 2.90 (Aug 2nd low) and any violation below will drag the pair till 2.76 (161.8% retracement of 3.04 and 4.145)/2.63.

- News

- Economy

- Central Banks
- Investing
- Research
- Roundups
- Digital Currency
- Insights
- Technical Analysis
- Technology
- Business
- Law
- Health
- Nature
- Fintech
- Science
- Topic
- Opinions
- ©Econometrics LLC . All Rights Reserved.
LTC/EUR struggles to close above 200- day MA, good to sell on rallies
Wednesday, August 17, 2016 11:06 AM UTC
Editor's Picks


- Market Data
Most Popular


