


 Goldman Sachs Sees Fed Holding Interest Rates Steady Until 2027
  Gold Tumbles Below $4,400 on NFP Shock: Fed Easing Bets Crater, Sell on Rallies to $4,300
  Trump’s Iran Strategy: What Has Been Achieved After Three Months of Conflict?
  Goldman Sachs: US Dollar Likely to Stay Strong Despite Oil Price Retreat
  AI Memory Boom Sparks Global Chip Supply Crunch
  SpaceX Stock Gets $175 Target as Analysts See Massive Growth Ahead


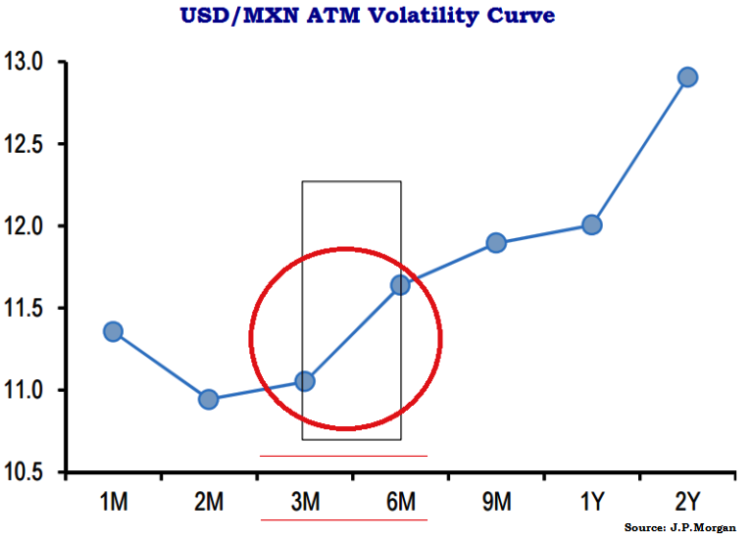
As shown in the figure, volatility curve for USD/MXN pair is steeply upward between 3M-6M segment, relatively stagnant between 6m-1Y and steep spike again beyond 1Y segment.
Since the 3M-6M sector of the USD/MXN vol curve is steep enough and implied volatilities are historically eminent enough despite their substantial decline this month such that 3M FVAs look reasonable sells.
Our slightly bearish inclination on the peso in Q2 leads the forecast at 15.35-25 levels, but spot in a 15.17-15.38 range still looks around fair versus coincidental risk metrics.
FVAs are the right instrument to sell MXN vol with rather than straight straddles since realized volatilities are still clocking at or above IV, so vol carry in the former is flat-to slightly negative.
If this were to change as the drag both delivered and implied vol lower, FVA shorts would benefit too from the Vega re-mark in addition to curve slide.
We pair a MXN FVA short with a NOK FVA in part due to a shared dependency on commodity price fluctuations, but mostly because NOK as high-beta proxy for EUR can hedge away some of the systemic risk of outright MXN shorts without any carry penalty.

- News

- Economy

- Central Banks
- Investing
- Research
- Roundups
- Digital Currency
- Insights
- Technical Analysis
- Technology
- Business
- Law
- Health
- Nature
- Fintech
- Science
- Topic
- Opinions
- ©Econometrics LLC . All Rights Reserved.
Short MXN volatility through USD/NOK – USD/MXN 3M3M FVA spreads
Friday, June 5, 2015 7:30 AM UTC
Editor's Picks


- Market Data
Most Popular


