


 Venezuela Earthquake Death Toll Climbs to 3,811 as Government Seeks Sanctions Relief
  Gold Prices Slip as Stronger Dollar, Fed Rate Outlook Weigh on Bullion
  Japan Producer Inflation Hits 7.1% in June, Fueling BOJ Rate Hike Expectations
  Gold Prices Set for Weekly Loss as Iran Tensions and Fed Rate Outlook Weigh
  Gold Price Rebounds as U.S.-Iran Tensions and Fed Minutes Keep Markets on Edge
  Oil Prices Slip but Stay on Track for Weekly Gains as U.S.-Iran Conflict Persists
  Fed Reaffirms 2% Inflation Goal, Vows Forceful Action to Anchor Price Expectations
  US Back-to-School Spending Seen Falling as Families Focus on Essentials
  Oil Prices Rise as U.S.-Iran Conflict Fuels Strait of Hormuz Supply Fears
  China Inflation Cools in June as Producer Prices Hit Four-Year High
  Bernstein Raises 2026 Nickel Price Forecast as Indonesia Tightens Supply
  Trump, Canada Reach Gordie Howe Bridge Deal Ahead of July 27 Opening
  Dollar Ends Week Higher as Yen Jumps on Japan Pension Fund Investment Plans
  Japanese Yen Rises as Pension Fund Plan and BOJ Rate Hike Bets Weigh on Dollar
  Gold Prices Slip as U.S.-Iran Conflict, Fed Rate Hike Bets Pressure Precious Metals
  Japan Eyes Bigger GPIF Investment in Domestic Assets as BOJ Independence Concerns Grow


Treasurer Jim Chalmers promised a Tax Expenditures Statement by the end of February – and he delivered this week, just in time, on Tuesday February 28.
The statement contains many headline-grabbing figures about the cost of various tax breaks, including claims made against income from rental properties (A$24.4 billion), the concessional or zero tax on employer superannuation contributions ($23.3 billion), concessional or zero tax on super earnings ($21.5 billion), and the tax-free treatment of the family home ($22 billion).
For some years under the Coalition, the statement was given the less-attractive title of Tax Benchmarks and Variations Statement, which was surprising given the statement was mandated in 1998 by Treasurer Peter Costello as part of the Charter of Budget Honesty.
The refurbished 200-page document has its old name back, plus a bit more. It is now called the Tax Expenditures and Insights Statement. The “insights” in the title relate to who the expenditures go to.
As to whether these additional insights are really that insightful, the answer is yes in some areas – but we need to be careful about others.
Spending by another name
The idea of the statement is to record those government expenditures delivered via tax breaks, so their costs can be compared with the cost of direct expenditures.
As an example, support for Australians who take out private health insurance can either be delivered via a tax rebate or a cash payment.
A tax rebate, effectively paid out of government funds but delivered through the tax system, might be called a “tax expenditure”, while a cash payment might be called a direct expenditure.
Either way, the cost to the government, and the amount paid to the recipient, is the same. Only the method of delivery, and how it’s recorded, is different.
Tax expenditures are usually invisible, because there’s no line item for them in the budget papers.
That’s why Costello initiated the publication of tax expenditures.
It’s also why the institute I run at the Australian National University is called the Tax and Transfer Policy Institute – because considering direct payments, but not payments made through the tax system, would be to consider only half the issue.
Support for high earners
The “insights” now included in the statement, along with the totals for each tax expenditure, are about who gets them, usually broken down by income and gender.
These are interesting, but not that insightful.
Guess who gets the biggest tax expenditures. Yes, you got it on one! The highest earners in the highest tax brackets.
Because they pay higher marginal tax rates, tax breaks benefit them the most.
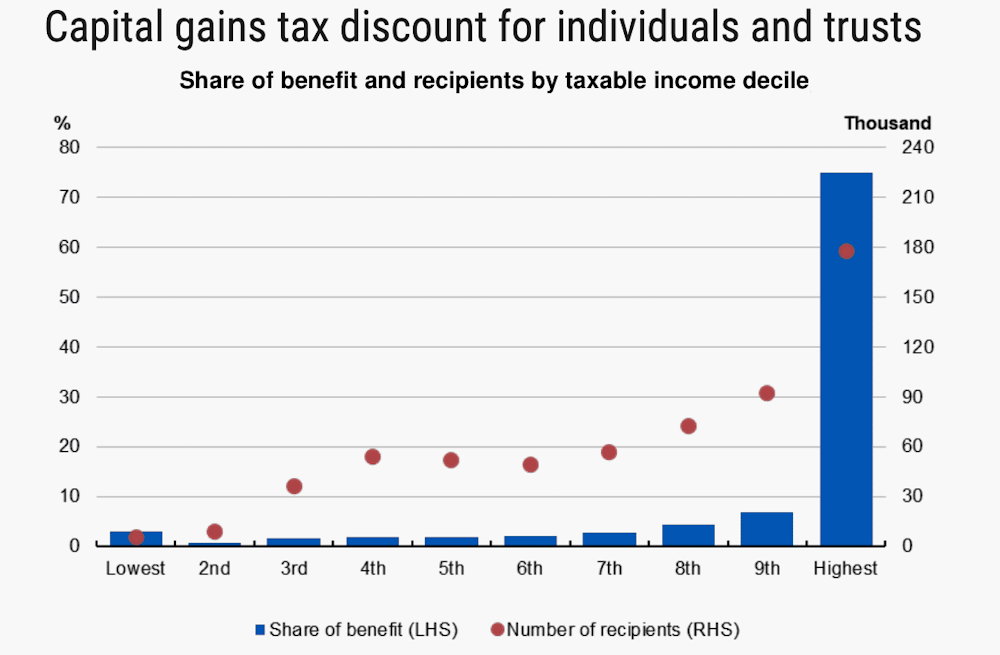
Commonwealth Treasury, 2022-23 Tax Expenditures and Insights Statement
And guess whether men or women get the biggest tax expenditures.
Again, you got it! There are more men in the highest tax brackets than women, so men get the lion’s share of tax expenditures.
All of which points to three dangers in interpreting the tax expenditures statement.
Big expenditures needn’t mean unfairness
The first danger is to conclude the large tax expenditures show “the rich do not pay enough tax”.
The statement says nothing about how much tax people actually pay.
In fact, Australia has one of the world’s most progressive tax systems. The top 10% pay roughly half of all the income tax collected.
The second (related) danger is assuming an uneven distribution of tax expenditures means an uneven distribution of government support.
Tax expenditures tell us nothing about other forms of government support.
Australia also does pretty well in fairness. Most government spending goes to those at the bottom of the income distribution. This is true if you look at cash transfers, and also for in-kind benefits such as education and health care.
Using data from the World Inequality Database, I calculate Australia’s after-tax Gini coefficient – the standard a measure of inequality – is about 30% fairer than its before-tax coefficient. This suggests the Australian system moves money from the more well-off to the less well-off.
It may not do it enough for some and it may do it too much for others, but there is no evidence of gross unfairness.
Abolition might raise less than imagined
The third danger is assuming that abolishing a tax expenditure would raise as much as it notionally costs.
In many cases it won’t, because people will change their behaviour and look for tax breaks elsewhere.
Even where this is not the case, abolishing two tax expenditures together might raise much less than the cost of the two added together. How? Removing one tax expenditure can mean less money for the other expenditure to give away.
The best example of this is in superannuation. If the $23.3 billion tax discount on super contributions was abolished, there would be less super in the funds to apply the discount on earnings. The earnings discount would be less than quoted.
The total of the tax expenditures set out in the statement exceeds $250 billion. Previous statements have warned about adding them together. This one does not.
Expenditures compared to what?
Each tax expenditure needs to be calculated against a benchmark – a standard tax rate that would otherwise be imposed. It isn’t always clear what the benchmark should be.
For income tax, it is assumed to be the standard set of income tax rates. But they may not be the right rates to apply to the taxation of income from savings.
A respectable case can be made for a dual-income tax system, with a progressive income-tax scale (as now) alongside a flat 10% rate on earnings from savings.
The 2017 tax expenditure statement took this idea up and produced an alternative estimate of superannuation tax expenditures using a different benchmark. The cost of the superannuation tax expenditures fell 80%!
One more thing. The use of trusts to avoid taxes isn’t really captured in the tax expenditures statement, in part because it is hard to work out how much tax minimisation takes place through trusts.
Often we do not know who the ultimate owners are. Loans made within trusts are not well-documented or regulated. Nor are property transfers and usage. There’s a case for a Trusts Investment and Insights Statement.
So bravo for the new Tax Expenditure (and Insights) Statement. And bravo for the new information on distributions. But please, use with care.


