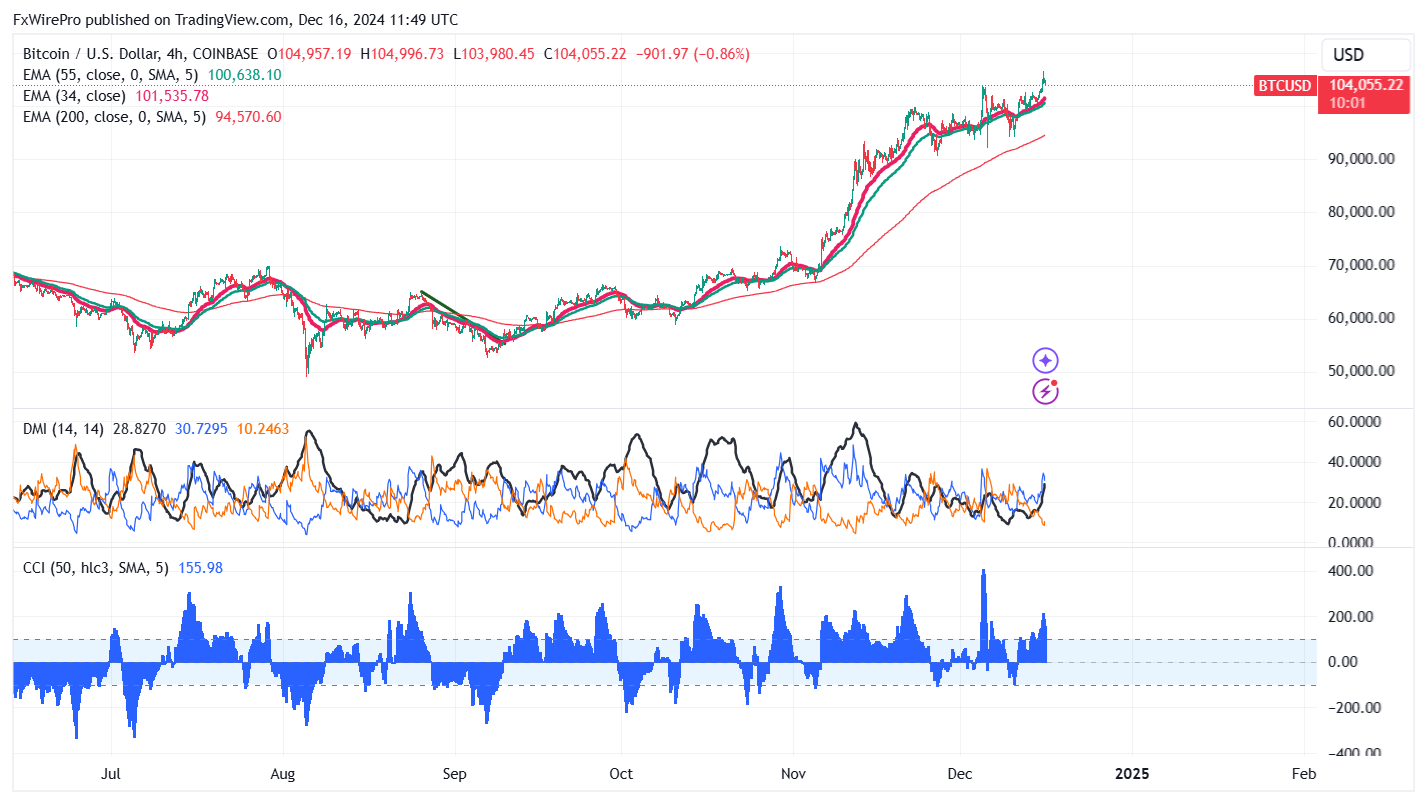
Recently, the cryptocurrency market has experienced significant ups and downs, leading to many traders losing positions. Almost $120 million in derivatives were liquidated when Bitcoin reached a new all-time high of $106,648 on December 15, 2024. This surge was primarily due to increased interest from major institutions and positive sentiment about Bitcoin's future potential.
Significant Whale Activity in Bitcoin
In the weekend before December 15, 2024, whale activity in Bitcoin (BTC) was notable, with over $1 billion in large transactions. This included a transfer of 500 BTC (about $50 million) from Binance to an unknown wallet, with 499 BTC returning to Binance shortly after. Other major transactions included 2,600 BTC valued at around $265 million, 3,000 BTC worth about $305.8 million, and 4,998 BTC (over $509 million) moved between unknown addresses. Additionally, 1,000 BTC (around $102.9 million) was transferred from Bybit to an unnamed wallet, showing strong interest from large investors.
Surge in Bitcoin ETF Inflows
In the past week, Bitcoin (BTC) ETFs saw significant inflows, indicating growing investor interest. Around $1.5 billion flowed into Bitcoin ETFs in December 2024, bringing the total inflows to nearly $10 billion since Donald Trump was declared the winner of the presidential election on November 5. Major funds from BlackRock and Fidelity Investments contributed to this growth, with BlackRock's ETF attracting particular attention. This trend reflects increasing interest in Bitcoin through ETFs.
Analysts Set Ambitious Price Target
Analysts at Bernstein have set a bold price target for Bitcoin (BTC), predicting that it could soar to $200,000 by the end of 2025.
Technical Analysis of BTCUSD
BTCUSD currently trades above both short-term (34-EMA and 55-EMA) and long-term (200-EMA) moving averages on the daily chart. Minor support is observed at $90,000; breaking below this could lead to targets at $86,700, $84,000, $80,000, or $75,800. Conversely, breaking through the primary supply zone at $106,600 would confirm intraday bullishness with the potential to reach $110,000. A secondary barrier at $110,000 indicates that closing above this level could lead to targets at $111,292, $115,000, or even $135,000.
Suggested Investment Strategy
Indicators on the 4-hour chart, like a bullish Commodity Channel Index (CCI) and Average Directional Movement Index, support this positive outlook. An investment strategy might involve buying on dips around $100,000, with a stop-loss set at $80,000, and targeting prices of $115,000 or $135,000.


 FxWirePro- Major Crypto levels and bias summary


