


 Sell the Bounce": Gold Rally Stalls Near $4165 as Fed Hawks Slam the Door on Rate Cuts — Targets $4000/$3600
  China’s AI Manufacturing Boom Masks Weak Consumer Economy, Citi Says
  Today’s space race could turn fatal if we don’t agree on new rules
  Bank Regulation Rollbacks in the U.S. and UK Could Increase Financial Risks, Study Warns
  How AI prompting turned writerly description into an everyday skill
  Trump’s Iran Strategy: What Has Been Achieved After Three Months of Conflict?
  AI Memory Boom Sparks Global Chip Supply Crunch
  Gold Surges Above Key EMAs, Bulls Eye Resistance Amidst Bullish Momentum
  Gold's 365-Day EMA Streak Since Oct 2023 Faces Its First Real Test at $3,980 — Break or Bounce to $4,140?


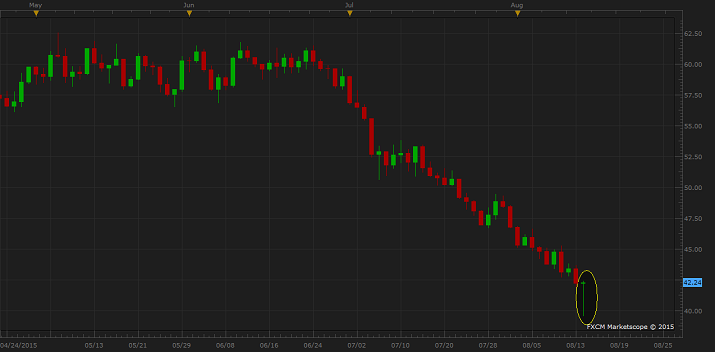
Today's sharp fall and equally sharp bounce back created is on the process of creating a unique candle in WTI daily chart, which makes today's final closing extremely pivotal in judging further moves ahead.
WTI is in the process of creating in very long legged Doji (Dragonfly) or long legged hammer in daily chart, both of which if appears after sharp downfall is considered as very strong bullish reversal signal.
The pattern will form if WTI is able to close today around $42.1-$42.2, which will form the doji or closing at high, which would form a hammer.
Though it definitely pays off to trade with the fundamental, which is supply glut as of now but these short term signals, derived from Japanese candle sticks should not be ignored.
Trading idea -
- WTI has reached all our targets ($55, 51, 46, 42), since short call was provided around $60 area. So with no positions we are ready to recommend short term buy if the above candles take form.
- To confirm the pattern a PDH (previous day high) break is required. However we stand ready to be little aggressive and stands ready to buy with $39.5/barrel as stop at lower price if the above mentioned candles are formed.


