


- News

- Economy

- Central Banks
- Investing
- Research
- Roundups
- Digital Currency
- Insights
- Technical Analysis
- Technology
- Business
- Law
- Health
- Nature
- Fintech
- Science
- Topic
- Opinions
- ©Econometrics LLC . All Rights Reserved.
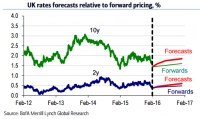
Bearish outlook for Gilts in 2016
Feb 18, 2016 11:29 am UTC| Insights & Views
At European leaders meeting on February 18th and 19th, there is scope for an agreement to be reached over the renegotiated terms of Britains EU membership, clearing the way for a referendum in June. If the UK were to...
Feb 18, 2016 09:32 am UTC| Insights & Views
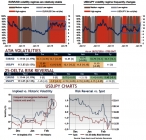
It is keenly observed that USDJPY evidences the frequent convergence between historic vols and IVs from end of January that is when Yellens 1st monetary policy meeting after last years rate hike in December.On the other...
How online advertising can work in a world of ad blockers
Feb 18, 2016 04:46 am UTC| Insights & Views Technology
Ask online advertisers what their biggest headache is today, and they will probably say ad blockers, which are browser extensions and add-ons that can remove adverts from websites. The growth of ad blocking has been...
If Islamic State is based on religion, why is it so violent?
Feb 18, 2016 04:38 am UTC| Insights & Views
Islamic States seemingly sudden prominence has led to much speculation about the groups origins: how do we account for forces and events that paved the way for its emergence? Today, religious studies scholar Aaron...

Feb 18, 2016 04:16 am UTC| Insights & Views Business
Cash-strapped state governments are looking to sell assets, such as ports, to raise funds. In 2014, the New South Wales government sold the Port of Newcastle for A$1.75 billion. The Victorian government is setting up the...
How new energy technologies can help South Africa ease its energy crunch
Feb 18, 2016 04:12 am UTC| Insights & Views Technology
Energy is an economic driver of both developed and developing countries. South Africa over the past few years has faced an energy crisis with rolling blackouts between 2008 and 2015. Part of the problem has been attributed...

How South Africa's financial sector handles risks linked to social media
Feb 18, 2016 04:09 am UTC| Insights & Views
The main focus of debates about social media is increasingly about the risks involved with its use. This is particularly true when it comes to large companies. Combined with the use of smartphones, social media is, for...


Global Energy Crisis: Iran Conflict Triggers Record Oil Supply Shock

U.S. Freezes Dollar Transfers to Iraq, Pressures Government Over Iran-Backed Militias

Asian Stocks Mixed as Tech Shares Decline While Japan’s Nikkei Hits Record High

Japan Exports Surge for Seventh Month as AI Demand Offsets Middle East Trade Disruptions

Oil Prices Slip Amid Iran Ceasefire Extension, Hormuz Disruptions Keep Markets Tense

Syrian Asylum Rejections Rise in Europe as Minority Safety Concerns Persist

Virginia Redistricting Vote Boosts Democrats Ahead of Midterm Elections

Trump Administration Files Fraud Charges Against Southern Poverty Law Center Over Informant Payments

Global Military Talks in London Aim to Reopen Strait of Hormuz and Protect Shipping

Canada-USMCA Review 2026: No Collapse Expected Despite July 1 Deadline

China vs. NASA: The New Moon Race and What's at Stake by 2030


NASA's Artemis II Mission: First Crewed Lunar Journey Since Apollo

NASA's Artemis II Crew Arrives in Florida for Historic Moon Mission
SpaceX Pivots Toward Moon City as Musk Reframes Long-Term Space Vision

SK Hynix to Invest $13 Billion in AI Chip Packaging Facility

Nvidia Pushes 800V Data Center Power Systems to Boost Efficiency and Cut Costs

LG Innotek Stock Hits Record High on $68M Automotive Wi-Fi 7 Deal

Samsung Boosts DRAM Supply to Tesla as AI-Driven Memory Demand Surges

SpaceX Eyes $60B Cursor Deal to Boost AI Power Ahead of IPO


- Market Data


