


 Goldman Sachs Flags 3 Key Risks Ahead of Europe’s Earnings Season
  Goldman Sachs Raises USD/JPY Forecast, Sees Yen Weakness Persist Through 2027
  Gold Pulls Back After Hitting $4,180 as Geopolitical Risk Sends Crude Higher
  Citi Raises TSMC Price Target as AI Chip Demand Strengthens Growth Outlook
  FxWirePro- Major Crypto levels and bias summary
  Bank of America Upgrades T-Mobile to Buy, Says LEO Satellite Fears Are Overdone


Early in November 2025, Bitcoin ETFs suffered terrible volatility, hemorrhaging over $1.2 billion in net outflows last week—the third worst since introduction—capping a six-day streak of almost $2.9 billion in total exits from October 29 to November 5. With $240 million in inflows, led by BlackRock's IBIT ($112.4M), Fidelity's FBTC ($61.6M), and ARK's ARKB ($84.4M), a short lifeline appeared on November 6, only for outflows to restart on November 7, with IBIT losing $131.4M and FBTC shedding $256.7M, respectively. While Ethereum ETFs lost $837.66 million during the sell-off, this sharply contrasts with October's $5.95 billion worldwide crypto ETF inflow that propelled BTC to all-time highs.
With net purchases falling below daily mining supply for the first time in seven months following the October 10 crash, institutional demand has plummeted as corporate treasuries and spot ETFs withdrew dramatically. Whale dynamics present a divided image: giants above 10,000 BTC have dumped $45 billion since August in constant distribution, but smaller holders below 1,000 BTC gather aggressively, with mid-tier whales neutral. Whales hovered up over 10,000 BTC ($1 billion) while pouring $1.8 billion to exchanges in a hectic 24-hour spike around November 7 near $100K support—suggesting tactical plays. Notwithstanding the pessimism, by November 9, BTC had recovered to $106K+, earning 2025 the questionable moniker "the most hated bull run ever."
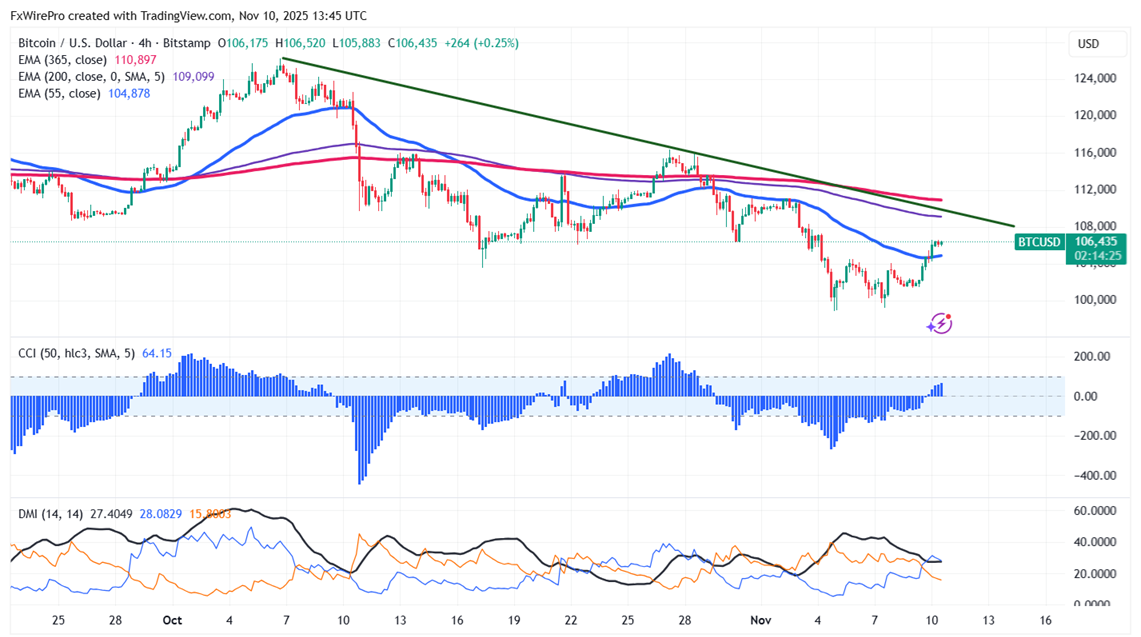
Technical Analysis: Key Levels to Watch for BTC/USD
BTC/USD recovered above $105000 as the US government ended the shutdown. The pair hits an intraday high of $106623 and is currently trading around $106288.
It trades above short-term (34-EMA and 55-EMA) and below long-term (200 and 365-EMA) moving averages on the 4-hour chart. Minor support is around $98500; breaking below this would drag the pair down to $95500/$92800/$90000. Immediate resistance is around $108000 indicates that closing above this level could lead to targets $115000/$120000/$126500.
Investment Strategy: Opportunities for Traders
Indicators (4-hour chart).
CCI(50)- Bullish
Directional movement index - Neutral
It is good to buy on dips around $102000 with a stop-loss set at $98000 for a TP of $115000/$120000.


