


 Today’s space race could turn fatal if we don’t agree on new rules
  How AI prompting turned writerly description into an everyday skill
  World Cup technology: from ref cams to AI analysts, cutting-edge research is changing the game
  Goldman Sachs: US Dollar Likely to Stay Strong Despite Oil Price Retreat
  J.P. Morgan Sees Potential Vestas Guidance Upgrade Amid Strong Wind Energy Demand
  Sell the Bounce": Gold Rally Stalls Near $4165 as Fed Hawks Slam the Door on Rate Cuts — Targets $4000/$3600
  How Donald Trump has changed the way diplomacy is done
  Trump’s Iran Strategy: What Has Been Achieved After Three Months of Conflict?
  Gold's 365-Day EMA Streak Since Oct 2023 Faces Its First Real Test at $3,980 — Break or Bounce to $4,140?


 - EconoTimes)


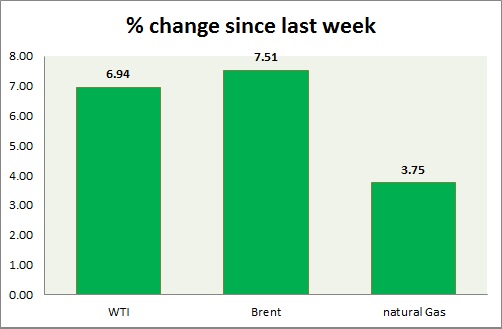
Energy segment is once again hit by selling at key levels. Weekly performance at a glance in chart & table
- Oil (WTI) - WTI fell today by more than 2% as tensions in Middle East failed to gain traction. Price has reached 1st target of $51/barrel and looks like will go down for now before testing the upper bound of current range at $54. Target to the downside is around $45. Immediate support lies at 47.5-47, 44-43.7 and resistance at 51.7-52.1, 54-54.5, 58.7-59.2.
- Oil (Brent) - Brent fell similar to WTI. Brent-WTI spread narrowed after yesterday's gain, trading at $ 7.7/barrel, might go further down if situation subsides. Last week it traded close to $11.5/barrel. Brent is trading at $57.7/barrel, down 1.8% today. Any impulsive upside would remain capped around $61/barrel. Immediate support lies at 56.7-56.3, 53 & resistance at 62.6-63.4.
- Natural Gas - Natural gas is the worst performer this week. Performance was weak after latest report from EIA showed inventory expanded by 12 billion cubic feet, as it stopped decline. Price pattern suggests that prices might drop down towards $2.44/mmbtu. Approaching summer is weighing on price. Natural Gas is currently trading at 2.64/mmbtu, down 0.75% today. Immediate support lies at 2.65, 2.55 & resistance at 2.74, 2.91, and 3.02.
|
WTI |
7.52% |
|
Brent |
4.54% |
|
Natural Gas |
-5.17% |


