


 Today’s space race could turn fatal if we don’t agree on new rules
  Trump’s Iran Strategy: What Has Been Achieved After Three Months of Conflict?
  Gold's 365-Day EMA Streak Since Oct 2023 Faces Its First Real Test at $3,980 — Break or Bounce to $4,140?
  World Cup technology: from ref cams to AI analysts, cutting-edge research is changing the game
  Sell the Bounce": Gold Rally Stalls Near $4165 as Fed Hawks Slam the Door on Rate Cuts — Targets $4000/$3600
  How AI prompting turned writerly description into an everyday skill
  Silver Cracks Key 365-Day EMA for First Time Since Feb 2024; Bears Eye $50 on Rallies


 - EconoTimes)


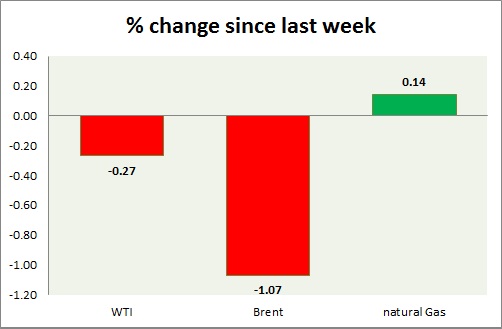
Energy segment is trading in red today. Weekly performance at a glance in chart & table.
Oil (WTI) -
- WTI bulls are struggling since last week after days of advance.
- WTI carved bearish doji in weekly chart. Further downside remains open. RSI is also around 50 level resistance.
- WTI is currently trading at $59.2/barrel. Immediate support lies at $55-54.6, $51.2-50 and resistance at $63-$65. $58 may continue to provide some interim support.
Oil (Brent) -
- Brent rally soured last week with price carving very bearish gravestone doji in daily chart.
- Brent-WTI spread dropped further around 50 cents, currently trading at $5.6/barrel.
- Brent is trading at $64.7/barrel. Immediate support lies at $63.7-63.2, 61.8-61.4 area and resistance at $ 70 region.
Natural Gas -
- Natural gas has broken above resistance area however price is down over profit booking today.
- Downside bias has diminished significantly. Buy trades might be entered with small quantity.
- US department of Energy is allowing partial export of natural gas.
- However bulls seem to be strong and will push prices towards $3.5/mmbtu, should $2.45 holds. Immediate support is around $2.65 for the buy trade. Key resistance is at 3.04-3.12 area.
- Natural Gas is currently trading at 2.84/mmbtu. Immediate support lies at $2.65, $2.44 area & resistance at $2.86.
|
WTI |
-0.27% |
|
Brent |
-1.07% |
|
Natural Gas |
+0.14% |


