


 Sell the Bounce": Gold Rally Stalls Near $4165 as Fed Hawks Slam the Door on Rate Cuts — Targets $4000/$3600
  Trump’s Iran Strategy: What Has Been Achieved After Three Months of Conflict?
  Today’s space race could turn fatal if we don’t agree on new rules
  World Cup technology: from ref cams to AI analysts, cutting-edge research is changing the game
  China’s AI Manufacturing Boom Masks Weak Consumer Economy, Citi Says
  Goldman Sachs: US Dollar Likely to Stay Strong Despite Oil Price Retreat
  Gold's 365-Day EMA Streak Since Oct 2023 Faces Its First Real Test at $3,980 — Break or Bounce to $4,140?


 - EconoTimes)


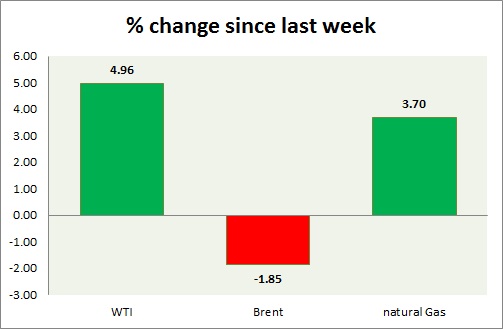
The energy segment over the last year remained the worst performer. Performance this week at a glance in chart & table -
- Oil (WTI) - Crude oil price remained depressed and continuing its whipsaw movement after last night's inventory report showed that stock built up at 8.4 million barrels were much larger than expected. WTI is currently trading at $49.4/ barrel, down 3% for the day. Immediate support lies at 48 and resistance at 54.
- Oil (Brent) - Brent remained the top performer as demand outlook improved and supply glut is now becoming more of an USA phenomenon. Brent-WTI spread has broken above $10 and currently trading close to $12. Further gain seems to be ahead. Brent is currently trading at $61.2/barrel, down 0.8% for the day. Immediate support lies at 58 & resistance at 63.
- Natural Gas - Natural gas is the worst performer in the segment and continues to decline amid higher production and lesser demand due to weather improvement. Today's inventory data showed stock drop was lower than expected at 219 billion cubic feet. Natural gas is currently trading at $ 2.72/mmbtu. Immediate support lies at 2.66 & resistance at 2.88. Prices could decline over the summer and even below $2/mmbtu.
|
WTI |
-2.87% |
|
Brent |
2.06% |
|
Natural Gas |
-7.59% |


