


 Gold Surges Above Key EMAs, Bulls Eye Resistance Amidst Bullish Momentum
  Gold's 365-Day EMA Streak Since Oct 2023 Faces Its First Real Test at $3,980 — Break or Bounce to $4,140?
  Trump’s Iran Strategy: What Has Been Achieved After Three Months of Conflict?
  AI Memory Boom Sparks Global Chip Supply Crunch
  Sell the Bounce": Gold Rally Stalls Near $4165 as Fed Hawks Slam the Door on Rate Cuts — Targets $4000/$3600
  J.P. Morgan Sees Potential Vestas Guidance Upgrade Amid Strong Wind Energy Demand
  Today’s space race could turn fatal if we don’t agree on new rules
  Morgan Stanley Sees Chinese Auto Market Recovery Gaining Momentum in Late Summer
  Goldman Sachs: US Dollar Likely to Stay Strong Despite Oil Price Retreat
  Silver Cracks Key 365-Day EMA for First Time Since Feb 2024; Bears Eye $50 on Rallies


 - EconoTimes)


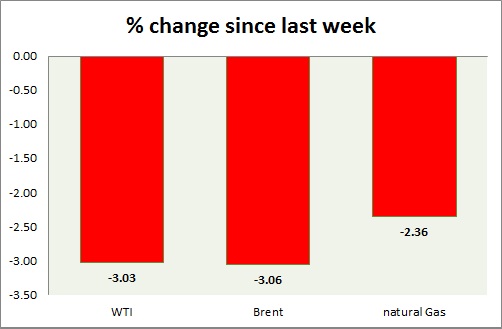
Energy pack is in red today. Weekly performance at a glance in chart & table.
Oil (WTI) -
- WTI failed attempt to gain soured as stocks rose at fastest pace since April. Today's range $46.3-43.7
- Stocks in US rose by 4.67 million barrels according to EIA and 7.6 million barrels according to API.
- WTI is currently trading at $43.9/barrel. Immediate support lies at $43.3, $41.5 area and resistance at $50 area.
Oil (Brent) -
- Brent dropped along with WTI, however relatively better performer than today. However that part soured after EIA data. Today's range - $48.3-50.8.
- Brent-WTI flat at $4.5/barrel. Further contraction possible.
- Brent is trading at $48.5/barrel. Immediate support lies at $48 area and resistance at $54.5, 59 region.
Natural Gas -
- Natural gas continues to consolidate around $2.7/mmbtu and likely to drop further, focus on inventory tomorrow. Today's range $2.70-2.645.
- Price might drop to $2.35/mmbtu, since support cleared. However $2.63 area proving to be strong support.
- Natural Gas is currently trading at $2.65/mmbtu. Immediate support lies at $2.55, $2.45 area & resistance at $2.75, $2.95, $3.04, $3.32.
WTI
+2.05%
Brent
+1.54%
Natural Gas
-1.25%


