


 China’s AI Manufacturing Boom Masks Weak Consumer Economy, Citi Says
  How AI prompting turned writerly description into an everyday skill
  Sell the Bounce": Gold Rally Stalls Near $4165 as Fed Hawks Slam the Door on Rate Cuts — Targets $4000/$3600
  J.P. Morgan Sees Potential Vestas Guidance Upgrade Amid Strong Wind Energy Demand
  Today’s space race could turn fatal if we don’t agree on new rules
  World Cup technology: from ref cams to AI analysts, cutting-edge research is changing the game
  Gold's 365-Day EMA Streak Since Oct 2023 Faces Its First Real Test at $3,980 — Break or Bounce to $4,140?


 - EconoTimes)


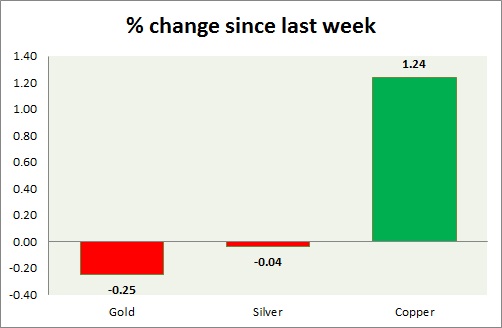
Metals as a pack doing worse this week even before FOMC. Performance this week at a glance in chart & table -
- Gold - Gold is trading below $1150, even before FOMC and testing the support intraday. A break below over FOMC might take gold as low as $1040/ troy ounce. Gold is currently trading at $1148/ troy ounce. Immediate support lies at 1144, 1132, 1040 & resistance at 1166, 1175, 1192.
- Silver - Silver is the best performer this week. FOMC might provide further direction. Mint ratio is at 74, up 0.15% today. Prices might reach as low as $14/troy ounce as key level remains broken. Silver is currently trading at $15.5/troy ounce. Support lies at 14 & resistance at 16.6.
- Copper - Copper is the worst performer this week. Copper is heavy over slowdown in China. Today's weaker house price data poured water over bulls. Copper is currently trading at $2.57/pound. Price pattern suggests loss towards 2.47 levels should the resistance at $ 2.72 holds. Immediate support lies at 2.52 & resistance at 2.64.
|
Gold |
-0.78% |
|
Silver |
-0.69% |
|
Copper |
-3.82% |


