


 US Futures Rise as Investors Eye Earnings, Inflation Data, and Wildfire Impacts
  Gold's 365-Day EMA Streak Since Oct 2023 Faces Its First Real Test at $3,980 — Break or Bounce to $4,140?
  Bank of America Posts Strong Q4 2024 Results, Shares Rise
  U.S. Treasury Yields Expected to Decline Amid Cooling Economic Pressures
  Energy Sector Outlook 2025: AI's Role and Market Dynamics
  Today’s space race could turn fatal if we don’t agree on new rules
  J.P. Morgan Sees Potential Vestas Guidance Upgrade Amid Strong Wind Energy Demand
  US Gas Market Poised for Supercycle: Bernstein Analysts
  China’s Growth Faces Structural Challenges Amid Doubts Over Data
  Goldman Sachs: US Dollar Likely to Stay Strong Despite Oil Price Retreat
  Lithium Market Poised for Recovery Amid Supply Cuts and Rising Demand
  Global Markets React to Strong U.S. Jobs Data and Rising Yields


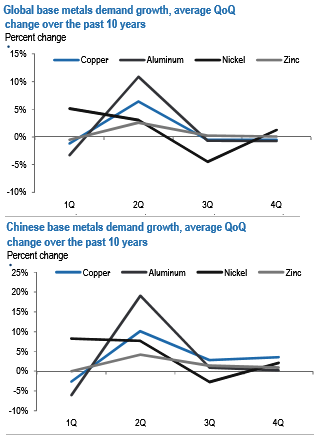
Over the past 10 years, quarterly data show that on average global demand across the base metals we cover has increased between 2.5% and 11% QoQ in the second quarter (refer above chart). With the exception of nickel, average QoQ demand growth in 2Q is by far the strongest of any quarter, particularly for aluminum and copper at 6% and 11% QoQ, respectively.
As with many dynamics in industrial metals, seasonality in global demand (weak Q1 followed by a strong Q2) has been increasingly shaped by China, given it accounts for nearly half of all metals demand.
More specifically, as the Chinese New Year holiday either falls in January or February, Chinese demand seasonality is characterized by very soft demand in 1Q followed by a stark incremental pickup in industrial metals activity in 2Q (refer above chart).
That being said, while ex-China demand follows a different seasonal pattern overall—generally stronger quarterly growth in 1Q than China with weaker growth in 3Q and 4Q—average QoQ demand growth for copper, aluminum, and zinc over the last 10years is still the strongest in 2Q outside of China as well (refer above chart).
As you can see from the exhibits, the one exception is nickel, which generally exhibits the strongest quarterly demand growth in 1Qs and the weakest in 3Qs due to the operational seasonality of stainless steel mills.
Beginning in 2Q, higher demand typically leads to a seasonal turnover in Chinese inventories Given the annual reawakening of Chinese metals demand following the January or February New Year holidays, it should come as little surprise that Chinese industrial metals inventories typically peak in March and draw through at least September.
Copper and aluminum stocks have pretty closely followed this script so far in 2017. More specifically, after increasing by more than 275 kmt so far this year, Chinese bonded and SHFE copper inventories combined are currently around 960 kmt, slightly higher than the 2012-2016 average for March.
Based on recent history, as demand picks up next quarter we expect stocks to begin drawing in April and continue to move lower through 3Q until they trough around 250 kmt lower, according to the five-year average (refer above chart).


