


 AI Memory Boom Sparks Global Chip Supply Crunch
  Today’s space race could turn fatal if we don’t agree on new rules
  Gold's 365-Day EMA Streak Since Oct 2023 Faces Its First Real Test at $3,980 — Break or Bounce to $4,140?
  With Iran and the US signing a peace deal, where does that leave Benjamin Netanyahu?
  Gold Surges Above Key EMAs, Bulls Eye Resistance Amidst Bullish Momentum
  Bank Regulation Rollbacks in the U.S. and UK Could Increase Financial Risks, Study Warns
  Sell the Bounce": Gold Rally Stalls Near $4165 as Fed Hawks Slam the Door on Rate Cuts — Targets $4000/$3600
  How AI prompting turned writerly description into an everyday skill
  China’s AI Manufacturing Boom Masks Weak Consumer Economy, Citi Says
  Morgan Stanley Sees Chinese Auto Market Recovery Gaining Momentum in Late Summer
  World Cup technology: from ref cams to AI analysts, cutting-edge research is changing the game
  J.P. Morgan Sees Potential Vestas Guidance Upgrade Amid Strong Wind Energy Demand
  How Donald Trump has changed the way diplomacy is done


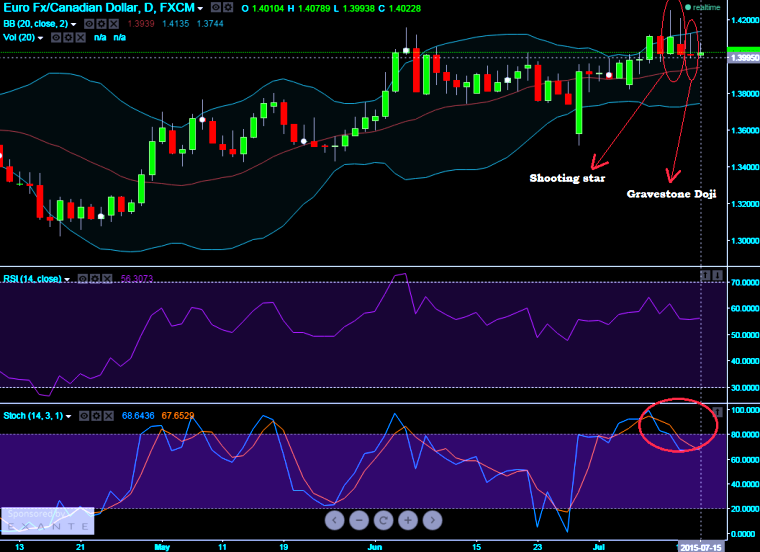
The formation of Gravestone doji and shooting star candlestick patterns at 1.4010 and 1.4109 levels on EOD charts confirms reversal of existing rallies.
The long upper shadow of the Shooting Star implies that the market tested to find where resistance couldn't hold on at 1.4254 levels and supply was located and accumulated.
This was highs of the day on that candle, when the market found the area of resistance at the above levels. This was the time when bulls started losing buying interest and bears began to push prices lower, ending the day near the opening price. Thus, the bullish advance upward was rejected by the bears.
In addition to that above pattern, gravestone doji pattern popped up to indicate that the course of the trend maybe be nearing a major turning point. Currently, a strong support at 1.4005 is traced on this pair. Any breach below this support would drag until 1.3881 or even upto 1.3758 levels.
While leading oscillator signifies the overbought heaviness as the %D line on stochastic curve crossover is seen above 80 levels and this has now been getting confirmed on weekly charts of this pair. RSI also signaled divergence of previous price rallies which is deemed as previous uptrend is does not sustain.

- News

- Economy

- Central Banks
- Investing
- Research
- Roundups
- Digital Currency
- Insights
- Technical Analysis
- Technology
- Business
- Law
- Health
- Nature
- Fintech
- Science
- Topic
- Opinions
- ©Econometrics LLC . All Rights Reserved.
FxWirePro: EUR/CAD uptrend reversal signal on gravestone doji and shooting star formation; sell rallies for target at 1.3758
Wednesday, July 15, 2015 12:39 PM UTC
Editor's Picks


- Market Data
Most Popular


