


 Gold Surges Above Key EMAs, Bulls Eye Resistance Amidst Bullish Momentum
  Morgan Stanley Sees Chinese Auto Market Recovery Gaining Momentum in Late Summer
  How Donald Trump has changed the way diplomacy is done
  Trump’s Iran Strategy: What Has Been Achieved After Three Months of Conflict?
  Silver Cracks Key 365-Day EMA for First Time Since Feb 2024; Bears Eye $50 on Rallies
  How AI prompting turned writerly description into an everyday skill
  With Iran and the US signing a peace deal, where does that leave Benjamin Netanyahu?
  Gold's 365-Day EMA Streak Since Oct 2023 Faces Its First Real Test at $3,980 — Break or Bounce to $4,140?


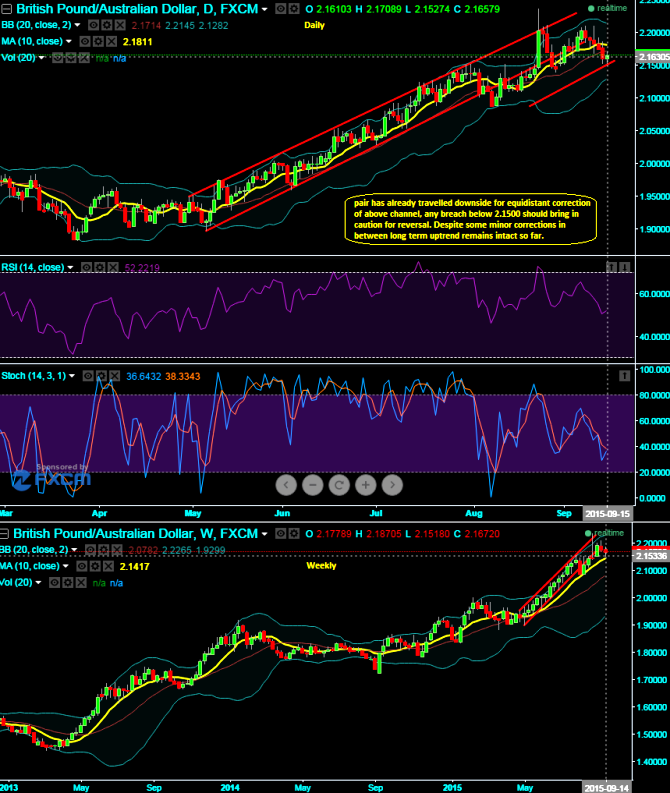
GBPAUD has already made equidistant travel towards downside (channel distance from 2.1862) when it has broken channel line at 2.1862 on daily graph, although RSI has reached overbought region on weekly chart and began showing downward convergence but signals of indecision about direction are piling up as there is no proper substantiation from subsidiary indicators. We can see weekly prices are trading well above moving average curve.
We believe GBPAUD uptrend has been quite healthy as the upswings are moving with considerable corrections at the right time and such corrections are factored in so far, you can expect some further minor corrections but certainly it has neither been steep spikes nor steep declines and you can make this out from daily charts as the oscillating indicators are also positively converging with price spikes and dips. Current 10 day moving average is evidencing long term uptrend remains intact, so it is quite absurd to buck the trend.
Trade tips: With reduced implied volatility of ATM options, it is quite riskier to build strategy with more number of shorts. Moreover, the pair has already rallied onto 2.2370 levels, so it is advisable to build portfolio with credit put spread at this point in time.

- News

- Economy

- Central Banks
- Investing
- Research
- Roundups
- Digital Currency
- Insights
- Technical Analysis
- Technology
- Business
- Law
- Health
- Nature
- Fintech
- Science
- Topic
- Opinions
- ©Econometrics LLC . All Rights Reserved.
FxWirePro: GBP/AUD steep slumps unlikely despite RSI oscillator signals overbought pressures
Tuesday, September 15, 2015 8:40 AM UTC
Editor's Picks


- Market Data
Most Popular


