


 J.P. Morgan Sees Potential Vestas Guidance Upgrade Amid Strong Wind Energy Demand
  Today’s space race could turn fatal if we don’t agree on new rules
  Goldman Sachs: US Dollar Likely to Stay Strong Despite Oil Price Retreat
  China’s AI Manufacturing Boom Masks Weak Consumer Economy, Citi Says
  How AI prompting turned writerly description into an everyday skill
  SpaceX Stock Gets $175 Target as Analysts See Massive Growth Ahead
  With Iran and the US signing a peace deal, where does that leave Benjamin Netanyahu?
  Bank Regulation Rollbacks in the U.S. and UK Could Increase Financial Risks, Study Warns
  Gold Surges Above Key EMAs, Bulls Eye Resistance Amidst Bullish Momentum
  Morgan Stanley Sees Chinese Auto Market Recovery Gaining Momentum in Late Summer


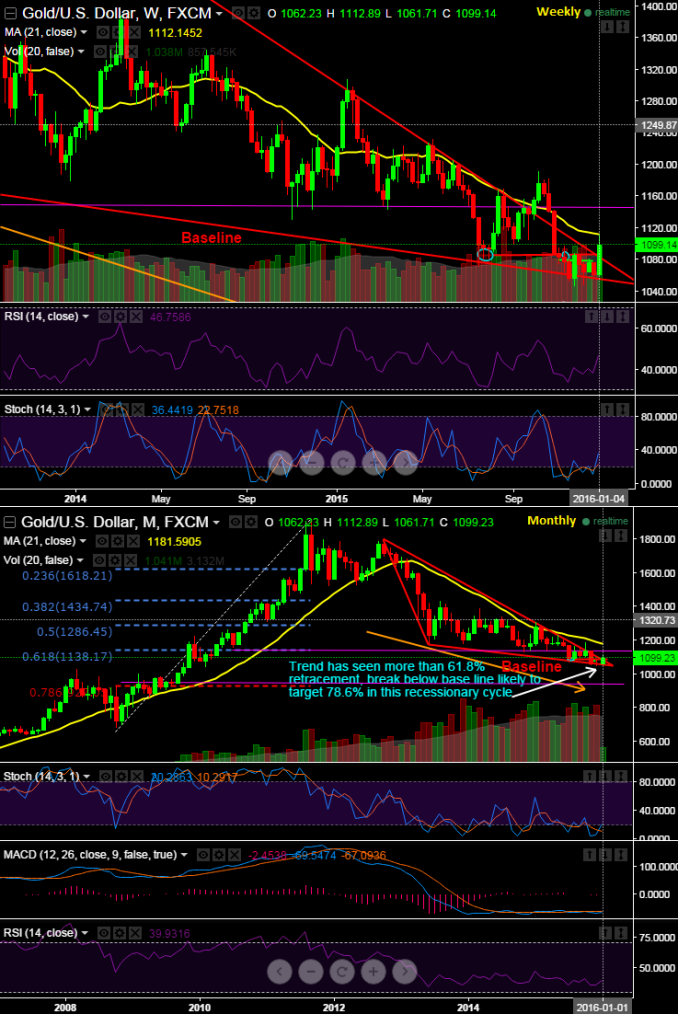
The gold has taken support at the baseline of descending triangle at around 1062.23 to spike all the way upto 1112.89 but from there it has not sustained that breach.
Bulls could not take it forward as 21DMA has acted as a resistance levels We believe, often and often we see bears trimming golds recent gains,
Today even if it makes an attempt of jump above baseline again (at 1058 levels) but bears could not resist to hold day highs (1068) to push it southwards.
On a long term basis, we can only see buying chances above 1132.17 and still carry bearish view as long as the prices maintain below 1132.17 (61.8% correction), so no surprise if the yellow metal plunges back to 1045.36 and then slipping towards 78.6% fibo targets.
While on daily terms, RSI shows divergence to the recent rallies (Currently, trending around 59.3941 while articulating), so this indicator justifies potential price dips.
Although there is no convincing %K line crossover, it is maintaining levels below 21DMA levels which is a signal to drag ongoing bearish trend
Hence, contemplating above technical indications, on medium term basis it is advisable to short rallies for targets of 1045 and 1030.10 levels with strict stop loss of 1132.17 levels.

- News

- Economy

- Central Banks
- Investing
- Research
- Roundups
- Digital Currency
- Insights
- Technical Analysis
- Technology
- Business
- Law
- Health
- Nature
- Fintech
- Science
- Topic
- Opinions
- ©Econometrics LLC . All Rights Reserved.
FxWirePro: Gold supports at descending triangle’s baseline – sustenance unlikely as bears push backwards to slip below slope
Friday, January 8, 2016 11:58 AM UTC
Editor's Picks


- Market Data
Most Popular


