


 FxWirePro: GBP/USD downtrend loses steam but outlook still bearish
  FxWirePro: EUR/NZD downside pressure builds, key support level in focus
  FxWirePro: USD/ZAR retreats slightly but bias is bullish
  FxWirePro: USD/CAD positions for another climb, eyes 1.4150 level
  NZDJPY Bullish Dip-Buy Setup: 93.60 Support Unlocks Path to 97
  FxWirePro:USD/JPY hovers near a four-decade low
  AUDJPY Extends Four-Day Rally on Yen Weakness: Bullish Dip-Buy Eyes 117-118
  FxWirePro- Woodies pivot (Major)
  FxWirePro: USD/CNY edges higher but bulls lack punch
  FxWirePro: USD/CAD edges lower but bullish outlook persists
  FxWirePro: GBP/AUD under pressure as pound continues to weaken
  FxWirePro: GBP/NZD gains some ground but outlook is bearish
  FxWirePro: GBP/USD slips as middle east tensions and oil surge pressure pound
  JPY Action Bias: USDJPY, EURJPY, and CADJPY Emerge as Top Extremely Bullish Picks
  Major Pairs Action Bias: USDCHF Emerges Extremely Bullish as EURUSD and GBPUSD Turn Deeply Bearish
  EUR/USD Slides After ECB Hold, Bearish Technicals Favor Rally Fades


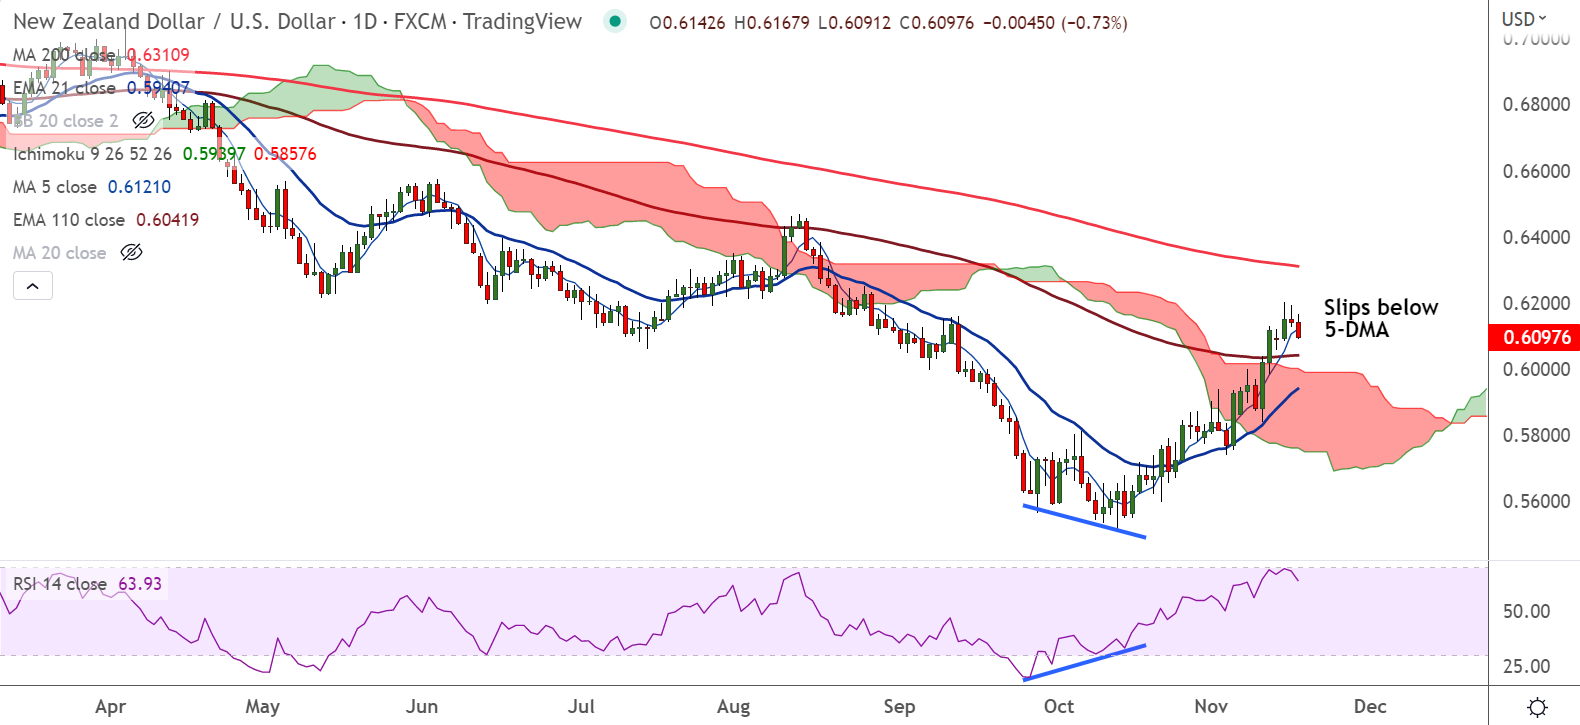
Chart - Courtesy Trading View
Technical Analysis:
- NZD/USD was trading 0.72% lower on the day at 0.6097 at around 11:50 GMT
- The pair is extending weakness for the second straight session, slips below 5-DMA
- Momentum is turning bearish, RSI has rolled over from near-overbought levels
- Chikou span is biased lower, GMMA indicator has turned bearish on the hourly charts
- Inverted Hammer formed on the dialy charts raises scope for downside in the pair
Support levels -0.6042 (110-EMA), 0.6029 (200H MA)
Resistance levels - 0.6122 (5-DMA), 0.6199 (Upper BB)
Summary: NZD/USD shows signs of minor reversal. Some pullback likely on account of overbought conditions. Next major support is seen at 110-EMA at 0.6041. Bullish invalidation only below daily cloud.


