


 GBPJPY Weakens Amid Yen Strength: Sell on Rallies Recommended
  FxWirePro- Major Pair levels and bias summary
  FxWirePro: USD/CAD steadies around 1.4220 ,retains bid one
  Alcohol is one of the most dangerous drugs, yet its presence is ubiquitous in social settings and celebrations
  USA at 250: the Black American struggle for life, liberty and the pursuit of happiness
  FxWirePro: GBP/USD gains some ground but outlook still bearish
  FxWirePro: USD/ZAR slips as weak U.S. Jobs data weighs on dollar
  FxWirePro- Major Pair levels and bias summary
  AI can be a personal trainer in your pocket – but is it safe?
  FxWirePro USD/JPY eases slightly ahead Of US June jobs report
  Despite its best efforts, Iran won’t be able to toll the Strait of Hormuz. Here’s why
  Morgan Stanley Names BAE Systems Top European Defence Stock Despite Lower Price Target
  FxWirePro: GBP/NZD sustains gains as uptrend remains strong
  Elon Musk is remaking the world, like Henry Ford before him – but more dangerously


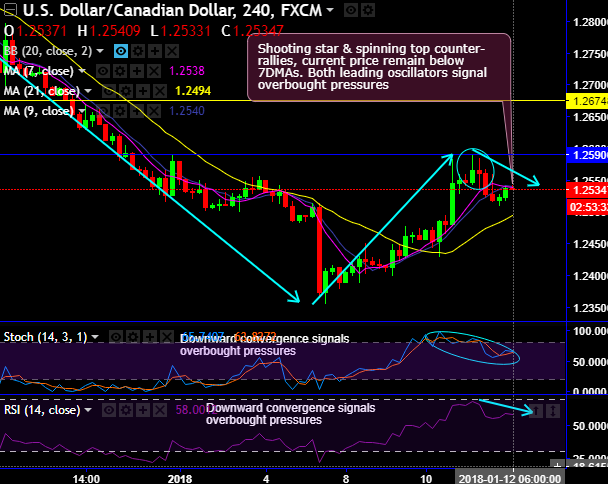
USDCAD bulls have had considerable bounces this week bottoming out at 1.2355 levels upto the peaks of 1.2590 levels, that’s where bears have resumed.
As a result, shooting star and spinning top patterns have occurred on intraday plotting at 1.2565 and 1.2560 levels respectively (refer 4H charts).
Consequently, these bearish patterns have countered previous rallies, the current prices still remain well below 7DMAs despite the attempts of bull rallies. While both leading oscillators signal overbought pressures at this juncture.
Please be extra keen on last six months’ price behavior, although the intermediary bulls have managed to test the strong support at 50% Fibonacci levels, the rallies have been restrained below 21EMA levels couple of times in this span.
Strong supports were seen at 1.2068-1.1925, observe sharp rallies as the pair touches these levels, this event has happened twice in last two and half years. But in last 6-months, the prices have collapsed as and when it approached 21EMA levels. The same incidence has happened even in in this month’s price action.
Hammer occurs to bring in upswings but 3-black crow pattern coupled with EMA crossover & OB pressures signals weakness, current prices slid & restrained below 7EMAs
Thereby, you could observe the stiff resistance at 1.2921 levels, that’s where more bearish pattern candles have occurred, consequently, considerable price dips have slid below EMAs.
Well, let’s not isolate this analysis, to substantiate this bearish stance, both leading oscillators (RSI and stochastic indicators) converge downwards constantly to the ongoing price dips that signal the intensified momentum and strength the prevailing bearish sentiments. Same has been the case in monthly terms.
Contemplating sideway trend, at spot reference: 1.2535, it is wise to snap deceptive rallies to deploy boundary binaries with upper strikes at 1.2560 and lower strikes at 1.2494.
The trading between these strikes likely to derive certain yields in this perplexed trend in the short term and the major trend, more importantly, these yields are exponential from spot movements.
For cash or nothing, these options would be exercised if the forward prices to remain between both strikes (i.e. 1.2560 > Fwd price > 1.2494).
Currency Strength Index: FxWirePro's hourly CAD spot index is inching towards -115 levels (which is highly bearish), while hourly USD spot index was at -95 (bearish) while articulating (at 07:12 GMT). For more details on the index, please refer below weblink:
http://www.fxwirepro.com/currencyindex.
Both indices constitute a neutral outlook but with more bearish bias that is conducive to our above recommendation.
FxWirePro launches Absolute Return Managed Program. For more details, visit:


