


 Urban studies: Doing research when every city is different
  Oil Prices Dip Slightly Amid Focus on Russian Sanctions and U.S. Inflation Data
  Trump’s "Shock and Awe" Agenda: Executive Orders from Day One
  Moody's Upgrades Argentina's Credit Rating Amid Economic Reforms
  Geopolitical Shocks That Could Reshape Financial Markets in 2025
  FxWirePro: AUD/USD drifts lower, uninspired by jobs beat
  Energy Sector Outlook 2025: AI's Role and Market Dynamics
  Mexico's Undervalued Equity Market Offers Long-Term Investment Potential
  Indonesia Surprises Markets with Interest Rate Cut Amid Currency Pressure
  FxWirePro: USD/CAD hits 14-month high , Scope for further upside
  Gold Prices Fall Amid Rate Jitters; Copper Steady as China Stimulus Eyed
  FxWirePro: EUR/AUD bullish outlook with scope to target 1.6500
  China’s Growth Faces Structural Challenges Amid Doubts Over Data
  Sterling Slump Sends GBPJPY Toward 212.60 — Bearish EMA Stack Eyes 210
  China's Refining Industry Faces Major Shakeup Amid Challenges
  S&P 500 Relies on Tech for Growth in Q4 2024, Says Barclays
  Global Markets React to Strong U.S. Jobs Data and Rising Yields


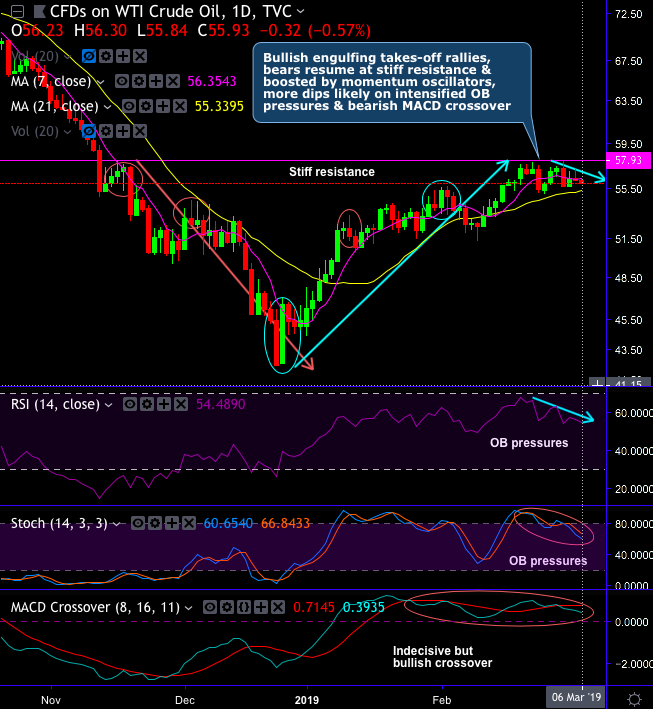
WTI crude oil’s bullish price sentiments are somewhat exhausted after a strong rise through most of February. As a result, WTI CFDs has spiked about 6.02%.
But for now, ahead of the US EIA’s inventory reports, WTI crude bears seem to have been resumed.
The EIA’s previous levels showed that crude oil production reached 12 million barrels per day (mbpd) for the first time last week. Crude oil output has dipped to -8.6 mbpd from previous 3.7 mbpd, while consensus was about 2.8 mbpd.
Technical and Candlestick Patterns: WTI crude’s bullish engulfing pattern at $46.57 levels, has taken-off rallies above 21-DMA, but the bears resume at the stiff resistance of $57.93 levels. The selling pressures are boosted by both the momentum oscillators, RSI and stochastic curves show downward convergence to the mild price dips to indicate overbought (OB0 pressures.
On a medium-term perspective, sharp rallies have been observed after bottoming out at $42.40 levels. The interim upswings, for now, are restrained below 21-EMAs (refer monthly chart).
The major downtrend continuation seems to be on cards as both technical indicators signal weakness on this timeframe. The consolidation phase took place upon hammer & dragonfly doji formations at $33.73 and $33.87 levels but 3-black crow pattern has occurred at $45.40 levels to counter with steep slumps below EMAs, the bearish pattern coupled with the bearish signals of technical indicators still signal weakness (monthly plotting).
Overall, one could foresee topsy-turvy swings the major trend of this energy commodity in 2019 and more dips likely on the intensified OB pressures & bearish MACD crossover in the near term.
Trading Recommendations: Contemplating technical rationale, we’ve advocated initiating longs in NYMEX WTI June 2019 and short NYMEX WTI December 2019 spread on hedging grounds at - $1.19/bbl in the recent past, with the target of +$2/bbl and stop loss of -$2/bbl
Currency Strength Index: FxWirePro's hourly EUR spot index is inching towards -19 levels (which is mildly bearish), while hourly USD spot index was at 129 (highly bullish) while articulating (at 10:42 GMT).
For more details on the index, please refer below weblink: http://www.fxwirepro.com/currencyindex


