


 With Iran and the US signing a peace deal, where does that leave Benjamin Netanyahu?
  J.P. Morgan Sees Potential Vestas Guidance Upgrade Amid Strong Wind Energy Demand
  Trump’s Iran Strategy: What Has Been Achieved After Three Months of Conflict?
  AI Memory Boom Sparks Global Chip Supply Crunch
  Gold Surges Above Key EMAs, Bulls Eye Resistance Amidst Bullish Momentum
  Today’s space race could turn fatal if we don’t agree on new rules
  World Cup technology: from ref cams to AI analysts, cutting-edge research is changing the game
  Goldman Sachs: US Dollar Likely to Stay Strong Despite Oil Price Retreat
  Sell the Bounce": Gold Rally Stalls Near $4165 as Fed Hawks Slam the Door on Rate Cuts — Targets $4000/$3600
  Bank Regulation Rollbacks in the U.S. and UK Could Increase Financial Risks, Study Warns
  How Donald Trump has changed the way diplomacy is done


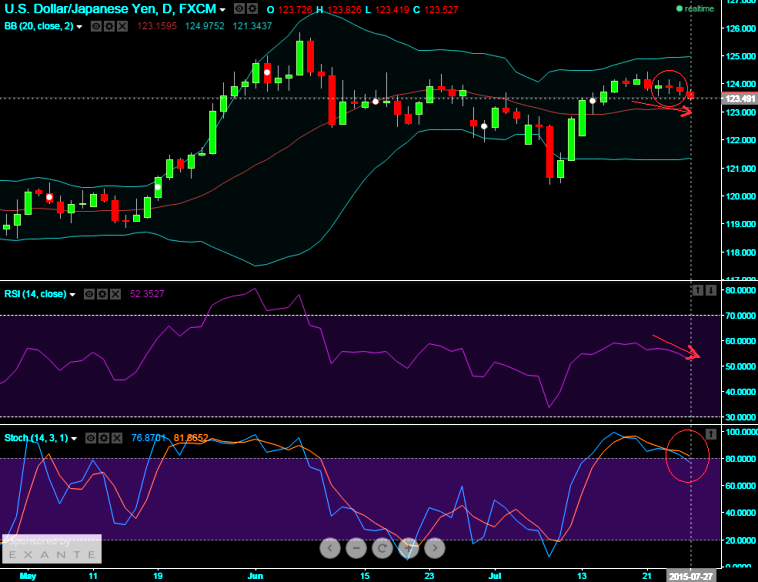
Technical glance:
EOD charts of USDJPY suggest weakness as the leading oscillating indicators such as RSI (14) and Slow stochastic evidence overbought pressure as strength index curve converges falling prices, while %D line crossover over above 80 levels on stochastic curves. And in addition back to back spinning top candles appeared to signify weakness on this pair.
If on a short straddle combination where a call and put options are written with delta's of 0.50 and -0.42 respectively how can this execution be delta hedged? The position is 1 of each written (underlying exchange price at 123.528 and ATM strike price at 123.530, 7 days maturity).
Delta hedging anything is pretty much the same process. Compute the delta of the position and then have a position in the underlying currency with -1*delta of the derivative position. Then have arrangements for adjusting the hedge so that it moves with the delta of the derivative position.
Write a straddle and you are short gamma and vega. You were delta hedging a position that is all about gamma and vega, all our bells and whistles would go off. There is a reason for doing this, but the person who has to ask how to do it doesn't know that reason.

- News

- Economy

- Central Banks
- Investing
- Research
- Roundups
- Digital Currency
- Insights
- Technical Analysis
- Technology
- Business
- Law
- Health
- Nature
- Fintech
- Science
- Topic
- Opinions
- ©Econometrics LLC . All Rights Reserved.
FxWirePro: Yen in mood of taming dollar’s upswings; Delta hedging of USD/JPY long straddles
Monday, July 27, 2015 6:17 AM UTC
Editor's Picks


- Market Data
Most Popular


