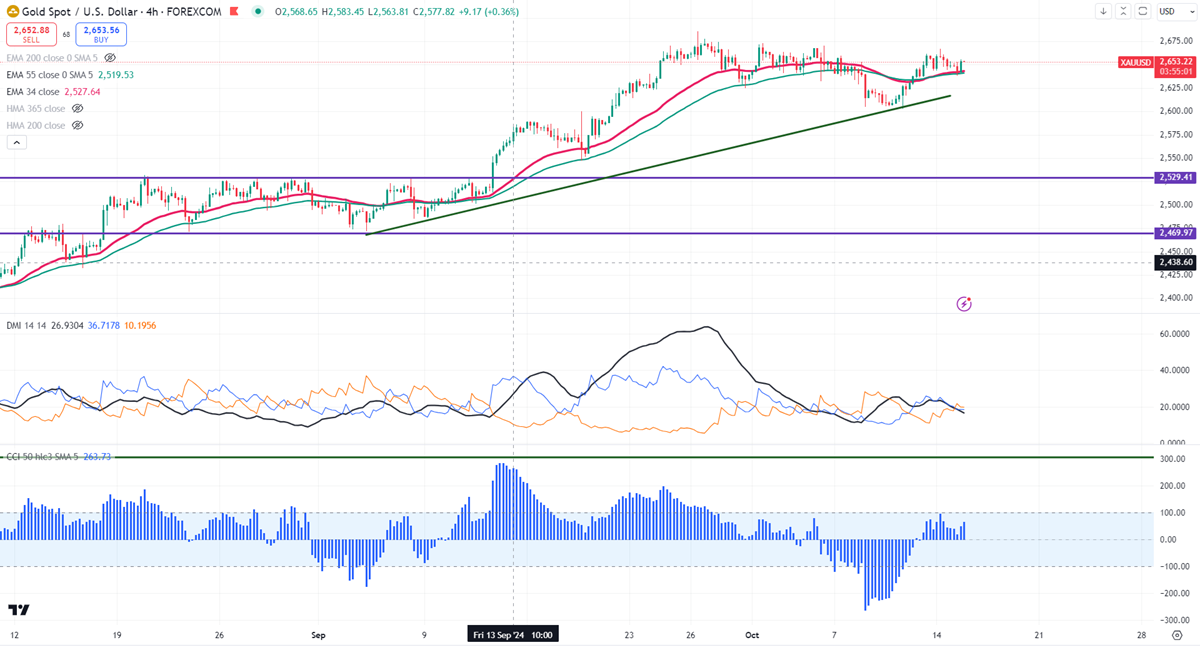
Gold pared most of its gains on the strong US dollar and surge in US treasury yield. It hit a low of $2638 yesterday and is currently trading around $2653.60.
CFTC -
Recent data from the CFTC Commitments of Traders report indicates that gold speculators have lowered their net long futures positions, moving down from a 54-month high reached at the end of September. Despite this reduction, net speculative long positions remain elevated, suggesting ongoing confidence among traders despite some profit-taking.
Chinese Economic Slowdown-
China's September economic data released recently was below market expectations, creating a bearish outlook for metals due to weaker demand. The consumer price index rose by only 0.4% year-on-year from 0.60% the previous year, while the producer price index fell by 2.8%. Furthermore, September trade figures showed exports increasing by 2.4% and imports by just 0.3%, both falling short of expectations.
Rate cuts from major central banks, prompted by easing inflation, provide support for gold at lower price levels.
US dollar index-
The US dollar index breaks significant resistance 103 after a long consolidation. Any close above 103 confirms a bullish continuation.
According to the CME Fed watch tool, the probability of a 25 bpbs rate cut in Nov increased to 86.8% from 85.2% a week ago.
Technical (4 hour chart)-
The yellow metal trades above short-term (34 and 55 EMA ) and below long-term (200- and 365 Hull MA) in the 4- hour chart.
The near–term support is around $2638, a break below targets $2624/$2600/$2570/$2560/$2545/$2520/$2470. Major bearish continuation only below $2470.The yellow metal faces minor resistance around $2670 and a breach above will take it to the next level of $2689/$2700.
Indicator (4- hour chart)
CCI (50)- Bullish
Average directional movement Index - Neutral
It is good to buy on dips around $2628-30 with SL around $2600 for TP of $2700.