


 Goldman Sachs Flags 3 Key Risks Ahead of Europe’s Earnings Season
  Bernstein Names IAG, Ryanair as Top European Airline Stocks Ahead of Earnings
  Morgan Stanley Says China’s Reusable Rocket Progress Poses Long-Term Challenge to SpaceX
  Gold Pulls Back After Hitting $4,180 as Geopolitical Risk Sends Crude Higher
  Gold Surges Past $4150 on Dovish Fed Signals and Weak Jobs Data; Bullish Outlook Prevails
  US Inflation Expected to Ease in June, but Fed Rate Hike Risks Persist Amid Middle East Tensions
  Goldman Sachs Raises USD/JPY Forecast, Sees Yen Weakness Persist Through 2027


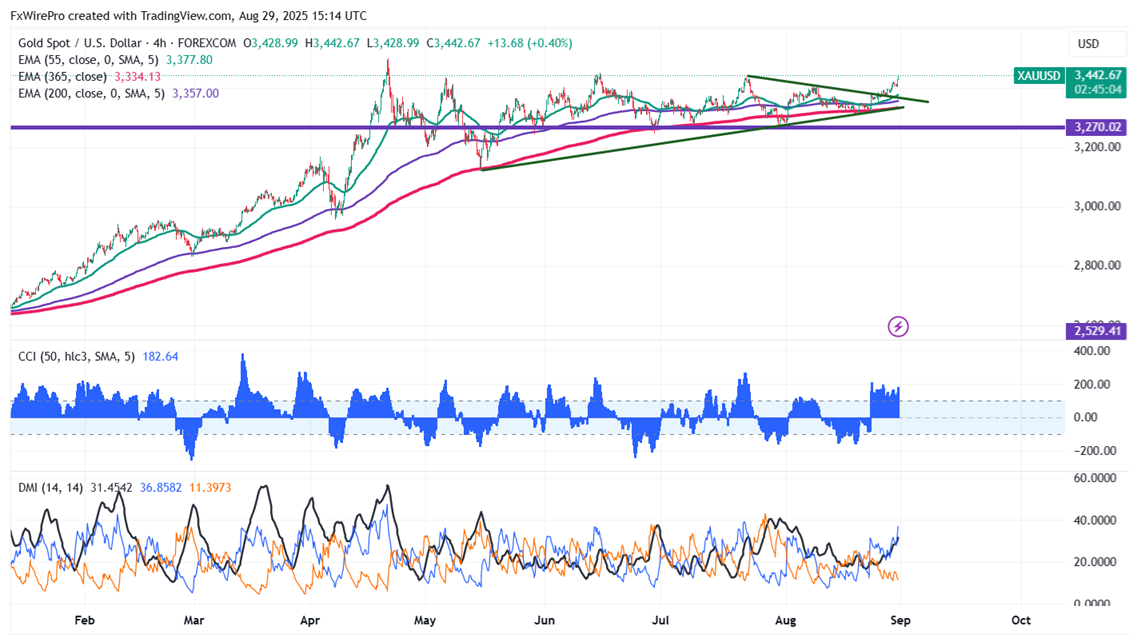
Gold prices gained sharply after the US inflation data. It hit an intraday high of $3441.58 and is currently trading around $3440.
The US Core PCE Price Index, released on August 29, 2025, rose 0.3% month-over-month in July, matching economists' expectations and June's rate, while the annual rate increased to 2.9% from 2.8%, the highest since February 2025. Excluding volatile food and energy prices, this key Federal Reserve inflation gauge indicates persistent inflationary pressures, complicating potential interest rate cuts in September 2025 as policymakers balance price stability and economic growth.
According to the CME Fed Watch tool, the chances of 25 bpbs rate cut in Sep 17th 2025 meeting have increased to 89.20% from 84.70% a week ago.
Technical Analysis: Key Levels and Trading Strategy
Gold prices are holding above the short-term moving average 34 EMA and 55 EMA) and the long-term moving averages (200 EMA) on the 4-hour chart. Immediate support is at $3410, and a break below this level will drag the yellow metal to $3375/$3356/$3320 $3300/$3290/$3275/$3245/$3200. The near-term resistance is at $3450 with potential price targets at $3475/$3500/$3550.
It is good to buy on dips around $3410-12 with a stop-loss at $3375 for a target price of $3500.


