


 J.P. Morgan Sees Potential Vestas Guidance Upgrade Amid Strong Wind Energy Demand
  Bank Regulation Rollbacks in the U.S. and UK Could Increase Financial Risks, Study Warns
  How AI prompting turned writerly description into an everyday skill
  Silver Cracks Key 365-Day EMA for First Time Since Feb 2024; Bears Eye $50 on Rallies
  How Donald Trump has changed the way diplomacy is done
  Trump’s Iran Strategy: What Has Been Achieved After Three Months of Conflict?
  SpaceX Stock Gets $175 Target as Analysts See Massive Growth Ahead
  World Cup technology: from ref cams to AI analysts, cutting-edge research is changing the game


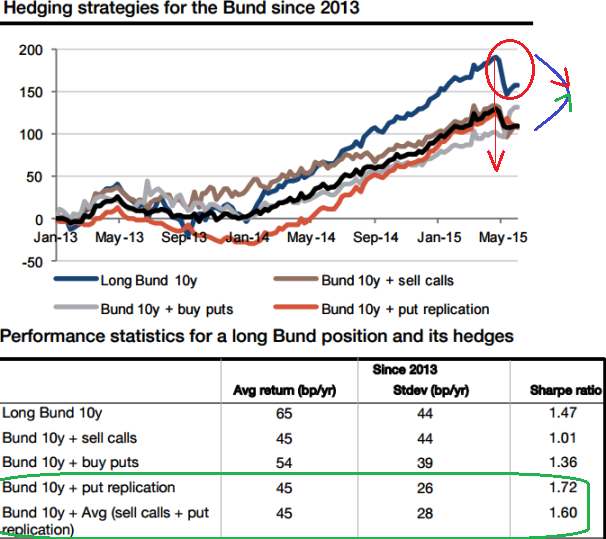
Well indeed with German bunds, What if the other way round.
Let's visualize a scenario where German bunds did not fetch this much yields and curve would have been narrowed. In which case the fund manager who would be operating his portfolios with systematic hedging strategies would have been paid more than half of the gain in return for a reduction in volatility of just one third including costs.
We've furnished different curves representing systematic hedging strategies and their performances in the above nutshell, this provides key performance statistics.
You can cautiously observe blue curve that represents 10y treasury declining from May has been a room for put replication & short call alternatives.
In terms of risk-adjusted performance, the Sharpe ratio of a long position in German Treasuries was 1.47, and the best that we could achieve with a systematic strategy was put replication at 1.72 while standard deviation of this avenue was the least 26. While SD was 28 on option combinations which would mean risk is higher with proportionate higher returns (see grey curve).
We tend to interpret these numbers are healthy because generally the greater the value of the Sharpe ratio, the more attractive the risk-adjusted return.

- News

- Economy

- Central Banks
- Investing
- Research
- Roundups
- Digital Currency
- Insights
- Technical Analysis
- Technology
- Business
- Law
- Health
- Nature
- Fintech
- Science
- Topic
- Opinions
- ©Econometrics LLC . All Rights Reserved.
Put replication proved more effective means of hedging
Wednesday, June 10, 2015 7:21 AM UTC
Editor's Picks


- Market Data
Most Popular


