FxWirePro: USD/SGD remains well supported below 1.37 mark, downside limited
Sep 19, 2016 02:09 am UTC| Technicals
USD/SGD is currently trading around 1.3646 marks. It made intraday high at 1.3691 and low at 1.3644 levels. Intraday bias remains bearish till the time pair holds key resistance at 1.3698 marks. A daily...

Sep 19, 2016 01:39 am UTC| Technicals
USD/KRW is currently trading around 1,123 levels. It made intraday high at 1,125 and low at 1,107 marks. Intraday bias remains bearish till the time pair holds key resistance at 1,127 levels. A daily close...
Eurozone wages grow at slowest pace in almost six years, raise concerns for ECB
Sep 16, 2016 14:05 pm UTC| Technicals
The European Unions statistics agency on Friday said Q2 wages were just 0.9 percent higher than in the same period a year earlier. It was the smallest increase since the third quarter of 2010 and a sharp slowdown from the...
FxWirePro: USD/CAD remains bullish as rally continues
Sep 16, 2016 14:04 pm UTC| Technicals
The USD/CAD pair remained bullish tone on Friday as buying interest continued as oil fell and domestic manufacturing sales rose by less than expected. Canadian manufacturing sales edged up by 0.1 percent in July from...
FxWirePro: GBP/USD dips below lower range, bearish bias increases
Sep 16, 2016 13:41 pm UTC| Technicals
The GBP/USD pair fell as low as 1.3107 in the early US session after data showed Consumer Price Index for August came better than expectations. Consumer Price Index rose 0.2 percent last month after being unchanged in...

Sep 16, 2016 12:50 pm UTC| Technicals
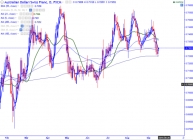
Major support 0.7250 (200- day MA). The pair has taken support at 200- day MA and jumped from that level. It is currently trading around 0.7307. AUD/CHF is trading slightly above 100- day MA and it trading well...

FxWirePro: Cable struggles to close above 10 –day MA, good to sell on rallies
Sep 16, 2016 10:58 am UTC| Technicals
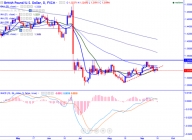
Major resistance- 1.3290 (10- day MA) Major support -1.3135 (50% retracement of 1.27893 and 1.34805) Cable has formed a temporary top around 1.32784 yesterday and declined from that level. It is currently...
- Market Data


