


 SpaceX Stock Gets $175 Target as Analysts See Massive Growth Ahead
  AI Memory Boom Sparks Global Chip Supply Crunch
  World Cup technology: from ref cams to AI analysts, cutting-edge research is changing the game
  China’s AI Manufacturing Boom Masks Weak Consumer Economy, Citi Says
  How Donald Trump has changed the way diplomacy is done
  Sell the Bounce": Gold Rally Stalls Near $4165 as Fed Hawks Slam the Door on Rate Cuts — Targets $4000/$3600
  How AI prompting turned writerly description into an everyday skill
  With Iran and the US signing a peace deal, where does that leave Benjamin Netanyahu?
  Today’s space race could turn fatal if we don’t agree on new rules
  J.P. Morgan Sees Potential Vestas Guidance Upgrade Amid Strong Wind Energy Demand


As stated in our recent post lackluster Aussie capex disappointed the streets.
- Overall, the CAPEX survey during Q1 was extremely fragile. Q1 capex fell 4.4% versus consensus numbers -2.2%. 2014-15 was revised marginally higher once adjusted by the 5yr realization ratio, but 2015-16 was very weak.
- The second estimate of AUD104bn translates to a drop to -23.5% previous survey was already weaker at -16% next FY.
- Non mining capex for 2015-16 remained as sluggish as the last survey -9.6%, showing virtually no signs of improvements.
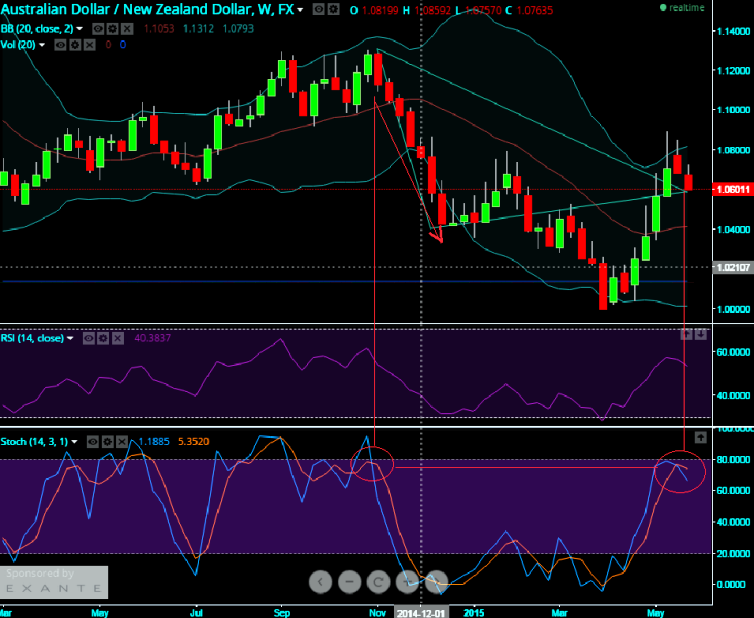
Medium to long term downtrend is most likely on this pair even though any short term minor recoveries in between.
On weekly chart the formation of descending triangular range by this pair is shown in the figure.
Currently the pair at Apex point around 1.0595 levels, this has been generally counted as a Bearish Pattern.
However, for further confirmation, the volumes should be heavier on the downside and lighter during the bounces.
In addition to that, oscillators such as RSI (14) early signs of downward convergence to the dips occurred recently.
Stochastic signals a significant %D line crossover as it happened in 3rd month exactly at the similar level, observe what happened thereafter.
%D is the 3 period moving average of the %K line. 3 period moving averages of %D gives slow stochastic.


