


 SpaceX Stock Gets $175 Target as Analysts See Massive Growth Ahead
  How AI prompting turned writerly description into an everyday skill
  AI Memory Boom Sparks Global Chip Supply Crunch
  With Iran and the US signing a peace deal, where does that leave Benjamin Netanyahu?
  How Donald Trump has changed the way diplomacy is done
  Goldman Sachs: US Dollar Likely to Stay Strong Despite Oil Price Retreat


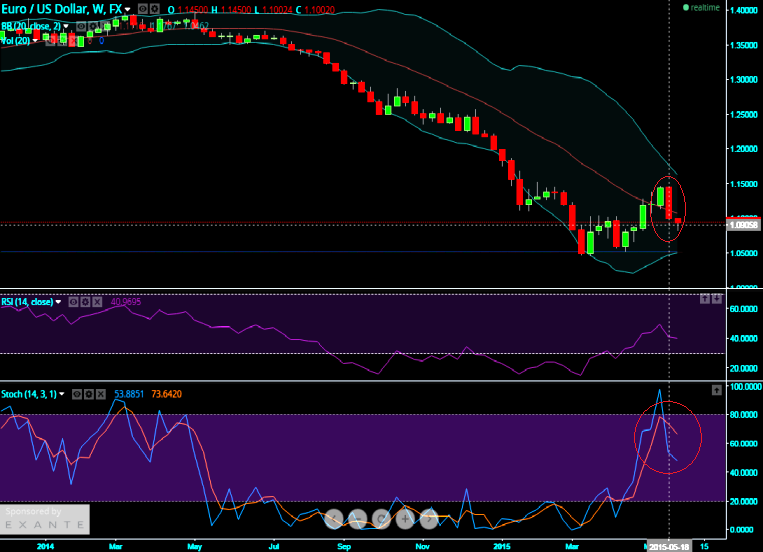
Technical insights: EURUSD:
On a weekly chart the pair formed a bearish engulfing pattern candle with tall real body engulfs completely the previously formed two and half weeks bullish momentum which signifies the downside risks to this pair.
Stochastic confirming the overbought situation as %D line crossover occurred near 80 levels on the same which is bearish sign again.
RSI (14) began showing downward convergence to the price line adds more pressure to the slumps.
But on daily chart the same pair trending at a crucial support around 1.0906 levels. If it manages to breach this crucial support then we could certainly see the pair testing below target levels with strict stop loss as well.
T1: 1.08510
T2: 1.0565
SL: 1.0976

- News

- Economy

- Central Banks
- Investing
- Research
- Roundups
- Digital Currency
- Insights
- Technical Analysis
- Technology
- Business
- Law
- Health
- Nature
- Fintech
- Science
- Topic
- Opinions
- ©Econometrics LLC . All Rights Reserved.
Bearish engulfing on EURUSD drags to further slumps
Friday, May 29, 2015 7:14 AM UTC
Editor's Picks


- Market Data
Most Popular


