


 SpaceX Stock Gets $175 Target as Analysts See Massive Growth Ahead
  J.P. Morgan Sees Potential Vestas Guidance Upgrade Amid Strong Wind Energy Demand
  How AI prompting turned writerly description into an everyday skill
  World Cup technology: from ref cams to AI analysts, cutting-edge research is changing the game
  Trump’s Iran Strategy: What Has Been Achieved After Three Months of Conflict?
  With Iran and the US signing a peace deal, where does that leave Benjamin Netanyahu?
  China’s AI Manufacturing Boom Masks Weak Consumer Economy, Citi Says


 - EconoTimes)


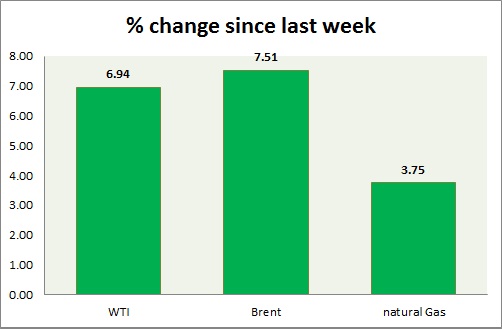
Energy segment is the best performer this week, breaking important resistance. Weekly performance at a glance in chart & table
Oil (WTI) -
- WTI has broken above three month high which in itself sign of strong buying interest.
- Bulls might once again move to test $54-54.5 area. Breakout of the area would push prices higher towards $60 as initial target area. $63-65 area comes next. Expect higher volatilities.
- WTI is currently trading at $55.3/barrel, down -1.8% today. Bulls were rejected at $56.5 area. Immediate support lies at $51.2-50, $47.5-47 and resistance at $54-54.5, and $58.9-59.7.
Oil (Brent) -
- Brent is the best performer this week, taken out resistance around $60. Further appreciation likely. However resistance area remains close.
- Brent-WTI spread widened over late night trading, currently trading at $7/barrel. However as of now, Brent is much closer to Resistance area than WTI, which might squeeze spread.
- Brent is trading at $62.3/barrel. Immediate support lies at $58-57 area and resistance at $ 62.6-64 region.
Natural Gas -
- Natural gas bounce back gathered further pace today, after price traded close to initial target area of $2.44/mmbtu. Broader downtrend remains intact, despite bounce back.
- Natural Gas is currently trading at 2.60/mmbtu. Immediate support lies at $2.12 area & resistance at $2.60, 2.66, 2.71.
|
WTI |
+6.94% |
|
Brent |
+7.51% |
|
Natural Gas |
+3.75% |


