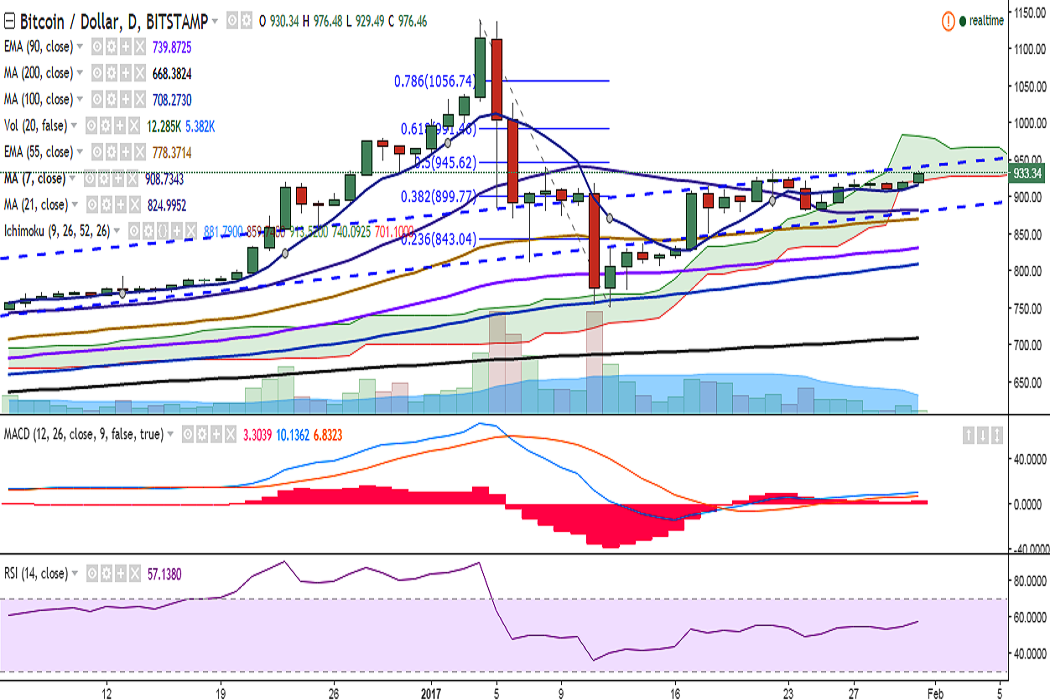
BTC/USD is moving higher after trading rangebound from the past couple of days. It is currently trading at 934 levels, just shy of trend line joining 628.99 and 745.19 (Bitstamp).
Ichimoku analysis of daily chart:
Tenkan Sen: 909.61
Kijun Sen: 944
Trend reversal: 827.91 (90 EMA)
On the upside, a consistent break above 940 levels (trend line joining 628.99 and 745.19) would see the pair testing 991 (61.8% retracement of 1139.89 and 751.34)/1000.
Momentum studies suggest bullish bias: RSI(14) is at 57, bias higher; and MACD line is above signal line; Stochs in overbought zone, bias higher.
On the downside, the pair has taken support near 908.90 (7-DMA) and a break below would target 868.26 (55-EMA)/ 827.91 (90 EMA).