


 Goldman Sachs: US Dollar Likely to Stay Strong Despite Oil Price Retreat
  Gold's 365-Day EMA Streak Since Oct 2023 Faces Its First Real Test at $3,980 — Break or Bounce to $4,140?
  SpaceX Stock Gets $175 Target as Analysts See Massive Growth Ahead
  J.P. Morgan Sees Potential Vestas Guidance Upgrade Amid Strong Wind Energy Demand
  Silver Cracks Key 365-Day EMA for First Time Since Feb 2024; Bears Eye $50 on Rallies
  Sell the Bounce": Gold Rally Stalls Near $4165 as Fed Hawks Slam the Door on Rate Cuts — Targets $4000/$3600
  Gold Surges Above Key EMAs, Bulls Eye Resistance Amidst Bullish Momentum
  Today’s space race could turn fatal if we don’t agree on new rules
  World Cup technology: from ref cams to AI analysts, cutting-edge research is changing the game
  Trump’s Iran Strategy: What Has Been Achieved After Three Months of Conflict?


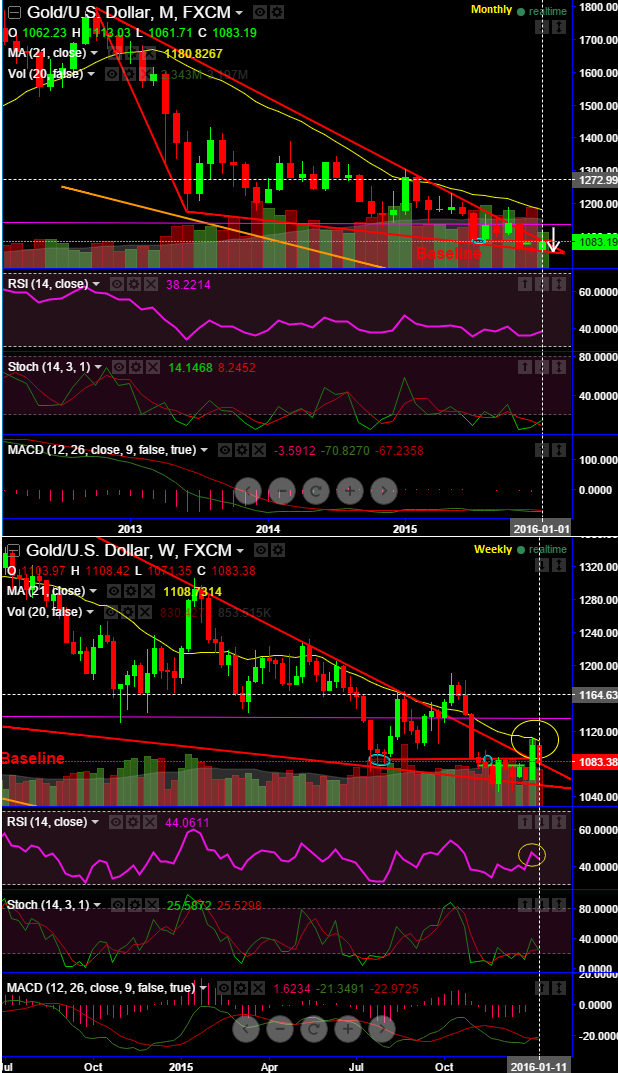
On monthly plotting XAUUSD has dropped back below sloping trend line of descending triangle to the current levels of 1083.14.
Weekly price tested 21DMA as resistance and rejected at 1108.42. that is where divergence is evidenced on leading oscillators.
We don't think prevailing price bounces to sustain in long run, see gold and silver struggled and rejected to break out and sustain strong trend line resistance at 1102 region on monthly charts.
One can only be bullish above convincing break these levels on monthly charts. Although both weekly and monthly RSI oscillators signal bullish convergence to approach this level we are not carrying adding longs without a decisive break out at above mentioned levels.
However, observe the price actions on confirmed continuance above or below moving average curve.
Prices above this lagging indicator help us understand the ability to catch a move above or below and remain in a move and develops a sustained move.
On the Comex division of the NYME, gold futures for February delivery were inched up 0.88% at 1,083.00.
The February contract ended Thursday's session 1.24% lower at 1,073.60 an ounce.
Futures were likely to find support at 1,063.20, the lows of January 4 and resistance at 1,091.50, (yesterday's highs).

- News

- Economy

- Central Banks
- Investing
- Research
- Roundups
- Digital Currency
- Insights
- Technical Analysis
- Technology
- Business
- Law
- Health
- Nature
- Fintech
- Science
- Topic
- Opinions
- ©Econometrics LLC . All Rights Reserved.
FxWirePro: Gold’s interim upswings unlikely to sustain - slides underway as bears lingering on sloping trend line of descending triangle
Friday, January 15, 2016 9:58 AM UTC
Editor's Picks


- Market Data
Most Popular


