


 FxWirePro- Major Pair levels and bias summary
  FxWirePro: USD/ZAR gains as stronger dollar outweighs upbeat South Africa's trade surplus
  FxWirePro: GBP/AUD bears maintain upper hand
  US Magnificent 7 Stocks Trend Score: Amazon & Microsoft Hit Extreme Bullish (+100) as Meta Drops to -100 — Key Resistance & Support Watchlist
  FxWirePro: AUD/USD gains some ground but outlook is bearish
  FxWirePro: EUR/ AUD dips below 1.6400 level, focus on near term support
  US Magnificent 7 Stocks Trend Score: Amazon & Microsoft Hit Extreme Bullish (+100) as Meta Drops to -100 — Key Resistance & Support Watchlist
  FxWirePro- Woodies pivot (Major)
  FxWirePro: GBP/NZD remains weak, eyes 38.2%fib support
  Nikkei Surges Past 65,000 on Suspected Yen Weakness: Tech Giants Like Advantest and NEC Lead Explosive Gains
  FxWirePro: GBP/NZD remains weak, eyes 38.2%fib support
  NZDJPY Retreats on Yen Strength – Bearish Setup Targets 90 After Hitting 92.75 Low
  AUDJPY Volatile After Massive Sell-Off: Sell Rallies at 113, Targeting 110 as Bearish Momentum Surges
  NZDJPY Bullish Rebound: Buy Dips as EMAs Align for 97 Target
  FxWirePro: GBP/USD rises as soft US data pressures dollar


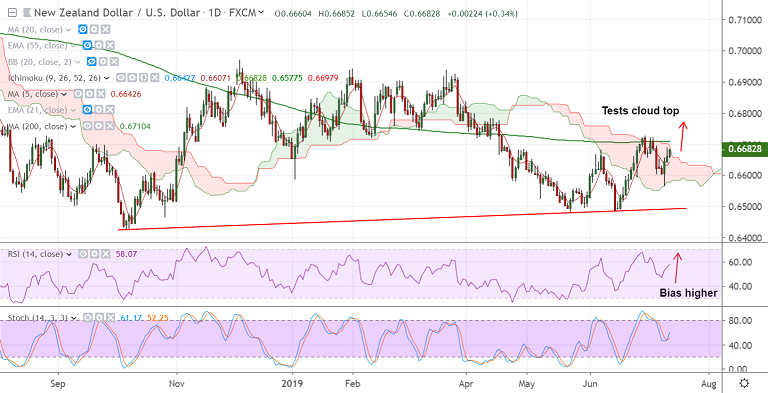
NZD/USD chart - Trading View
NZD/USD is trading at 0.6684 at 04:55 GMT, up 0.36% at the time of writing.
The pair has shown a break above 110-EMA and is on track to test 200-DMA at 0.6710.
The U.S. Consumer Price Index in June y/y fell to 1.6% from 1.8%. However, the core CPI inched higher to 2.1% to beat expectation of 2%.
Greenback gained traction after CPI data, pulling NZD/USD lower from session highs at 0.6689 overnight.
However, the pair has resumed gains on the day, technical indicators are turning bullish.
RSI is above 50 and sharply higher. 5-DMA has turned and Stochastics RSI are on verge of rollover from oversold levels.
Support levels - 0.6665 (110-EMA), 0.6642 (5-DMA), 0.66
Resistance levels - 0.6710 (200-DMA), 0.6754 (Upper BB), 0.6782 (Apr 15 high)
For details on FxWirePro's Currency Strength Index, visit http://www.fxwirepro.com/currencyindex.


