


 FxWirePro: GBP/USD rises as soft US data pressures dollar
  NZDJPY Bullish Rebound: Buy Dips as EMAs Align for 97 Target
  FxWirePro: GBP/NZD remains weak, eyes 38.2%fib support
  FxWirePro: NZD/USD consolidates overnight gains, but loses momentum
  FxWirePro- Major Crypto levels and bias summary
  FxWirePro: GBP/AUD drifts lower after BOE rate decision
  FxWirePro: USD/ZAR gains as stronger dollar outweighs upbeat South Africa's trade surplus
  NZDJPY Retreats on Yen Strength – Bearish Setup Targets 90 After Hitting 92.75 Low
  FxWirePro- Major Crypto levels and bias summary
  Nikkei Surges Past 65,000 on Suspected Yen Weakness: Tech Giants Like Advantest and NEC Lead Explosive Gains
  FxWirePro- Woodies pivot (Major)
  FxWirePro: USD/CNY dips to hit three year low,scope for further downside
  US Magnificent 7 Stocks Trend Score: Amazon & Microsoft Hit Extreme Bullish (+100) as Meta Drops to -100 — Key Resistance & Support Watchlist
  Major European Indices Score Extremely Bullish: DAX Eyes 26000, CAC Targets 8600, FTSE100 at 11000 – Key Levels to Watch
  Major FX Action Bias & US Market Sentiment: NZD/USD (Extremely Bullish) & AUD/USD (Bullish) Watchlist
  FxWirePro- Major Pair levels and bias summary
  AUDJPY Volatile After Massive Sell-Off: Sell Rallies at 113, Targeting 110 as Bearish Momentum Surges


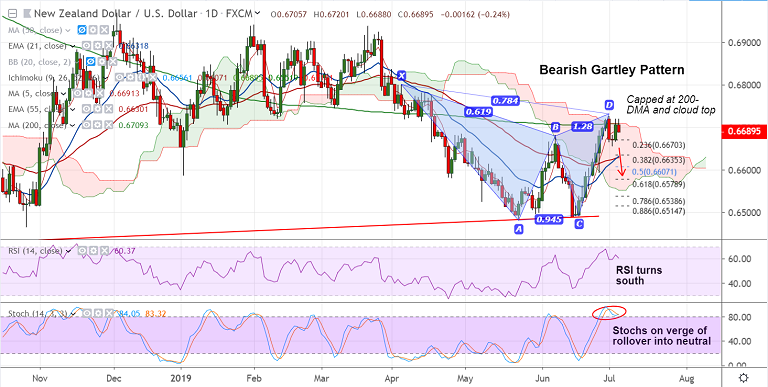
NZD/USD chart - Trading View
NZD/USD trades 0.25% lower on the day at 0.6688 at 07:45 GMT.
The pair retraced above 23.6% Fib with a Doji at lows, but bulls find stiff resistance at 0.67 region.
200-DMA (0.6709) and cloud top (0.6710) offer stiff resistance. Upside only on breakout above.
Technical indicators are turning bearish on the intraday charts. Oscillators are on verge of roll back from overbought levels.
Further, a 'Bearish Gartley' pattern formed on the daily charts keeps scope for weakness.
Focus will now be on the U.S. Non-farm Payrolls report and the implications for the FOMC this month.
GMMA on the daily charts shows change of trend (bias turning bullish). Short-term moving averages have crossed over the longer-term moving averages.
Breakout at 200-DMA and cloud will see upside till 0.6862 (55W EMA). Break below 110-EMA could see weakness till 0.6630.
For details on FxWirePro's Currency Strength Index, visit http://www.fxwirepro.com/currencyindex.


