


 FxWirePro- Major Crypto levels and bias summary
  FxWirePro: GBP/NZD remains weak, eyes 38.2%fib support
  Major FX Action Bias & US Market Sentiment: NZD/USD (Extremely Bullish) & AUD/USD (Bullish) Watchlist
  FxWirePro: USD/ZAR gains as stronger dollar outweighs upbeat South Africa's trade surplus
  NZDJPY Bullish Rebound: Buy Dips as EMAs Align for 97 Target
  FxWirePro: AUD/USD gains some ground but outlook is bearish
  Nikkei Surges Past 65,000 on Suspected Yen Weakness: Tech Giants Like Advantest and NEC Lead Explosive Gains
  FxWirePro: GBP/USD rises as soft US data pressures dollar
  FxWirePro- Major Crypto levels and bias summary
  FxWirePro: USD/CAD retreats after Canada posts stronger-than-expected GDP growth
  Major European Indices Score Extremely Bullish: DAX Eyes 26000, CAC Targets 8600, FTSE100 at 11000 – Key Levels to Watch
  FxWirePro: GBP/AUD drifts lower after BOE rate decision
  FxWirePro: GBP/AUD bears maintain upper hand
  US Magnificent 7 Stocks Trend Score: Amazon & Microsoft Hit Extreme Bullish (+100) as Meta Drops to -100 — Key Resistance & Support Watchlist
  FxWirePro: GBP/NZD remains weak, eyes 38.2%fib support


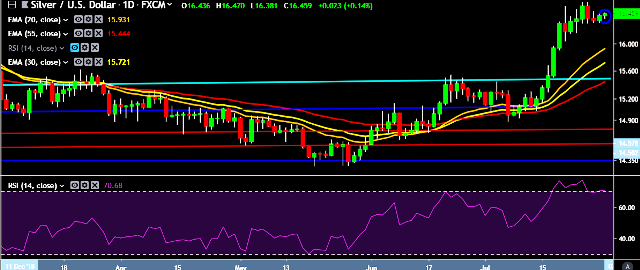
- XAG/USD is currently trading around $16.45 marks.
- It made intraday high at $16.47 and low at $16.38 levels.
- Intraday bias remains bullish till the time pair holds key support at $16.38 mark.
- A daily close above $16.43 will test key resistances at $16.57, $16.68, $16.80 and $16.97 marks respectively.
- On the other side, a daily close below $16.43 will take the parity down towards key supports at $16.27, $16.17, $16.02, $15.90, $15.70, $15.47 and $15.40 marks respectively.
- Important to note here that 20D, 30D and 55D EMA heads up and confirms the bullish trend in a daily chart.
We prefer to take long position on XAG/USD around $16.44, top loss at $16.37 and target of $16.57/$16.68.


