
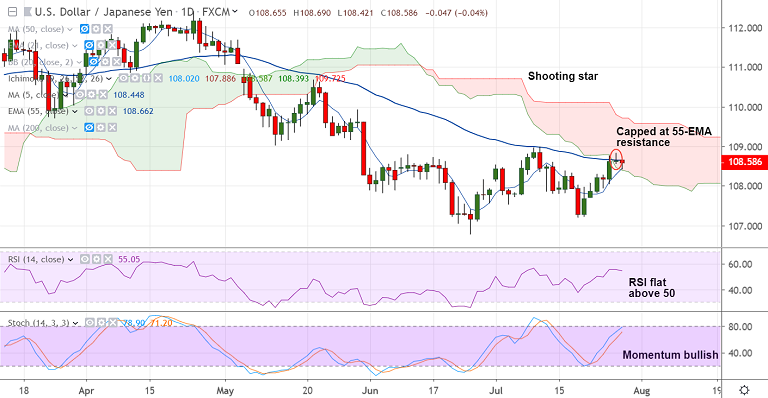
USD/JPY chart - Trading View
USD/JPY starts the week on a bearish note, hits session lows at 108.42 before paring some losses to trade at 108.60 at 05:50 GMT.
Data released earlier today showed Japan June Retail Trade figures printed at 0.5 pct y/y, beating expectations at 0.2 pct vs 1.3 pct previous.
Major trend in the pair is bearish. Upside has been capped at 55-EMA resistance and 'Shooting Star' at highs dents upside.
Stronger US economic data which further reinforced expectations that the Fed is unlikely to cut rates at its upcoming meeting on July 30-31 keep USD supported.
Rising US bond yields further underpin the greenback. But caution likely ahead of the key FOMC meet.
Markets also watch for possible resolution of the prolonged US-China trade dispute.
Support levels - 108.46 (5-DMA), 108, 107.81 (June 5 low)
Resistance levels - 108.66 (55-EMA), 109, 109.37 (110-EMA)
For details on FxWirePro's Currency Strength Index, visit http://www.fxwirepro.com/currencyindex.


