


 South Korea Q2 GDP Beats Forecasts as AI Chip Exports Drive Growth
  Oil Prices Head for Weekly Surge as Red Sea Attacks and Kazakhstan Supply Cuts Raise Disruption Fears
  Brent Oil Holds Above $100 as Red Sea Attacks, Iran Conflict Threaten Global Supply
  European Stocks Slip as Earnings, UK Inflation and ECB Decision Keep Investors on Edge
  India FMCG Q1 Earnings Preview: Higher Input Costs Likely to Weigh on Profit Margins
  Japan CPI Rises in June, but Core Inflation Stays Below BOJ’s 2% Target
  Gold Price Surges Above $4,100 as Middle East Tensions Boost Safe-Haven Demand
  US Stock Exchanges Face Earnings Test as Trading Boom Meets Crypto Competition
  US Dollar Pauses Rally as Middle East Tensions Support Safe-Haven Demand
  Trump Administration Imposes New Forced Labor Tariffs on 60 Trading Partners
  Gold Price Holds Weekly Gain as Middle East Tensions and Fed Rate Outlook Drive Market
  Global Leaders Push Back as Trump Imposes New Forced Labor Tariffs
  Pakistan Seeks $10 Billion U.S. Exchange Stabilization Fund to Boost Forex Reserves
  Iran Rejects U.S.-Backed Ceasefire as Trump Escalates Military Threats, Oil Tops $100
  Gold Price Climbs Above $4,130 as Middle East Tensions Boost Safe-Haven Demand
  Australia Jobs Surge in June Strengthens Case for More RBA Rate Hikes


It’s two weeks since the world woke up to the dreadful news of a Russian attack to Ukraine. Notwithstanding the incalculable costs in terms of human lives, as well as human capital and physical infrastructure, we’ve seen much turbulence in the financial markets. So what has happened so far?
Since markets tend to react to geopolitical risks, US Federal Reserve economists Dario Caldara and Matteo Iacoviello recently built a geopolitical risk index (GPR) to be able to compare events at different points in time. It is based on real-time reports in the news of war threats, terror threats, military build-ups, nuclear threats, acts of terror, beginnings of war and escalations.
You can see below their plot of the daily data, which dates back nearly 40 years. The most remarkable spikes capture the 1991 Gulf war, 9/11, the beginning of the Iraq war in March 2003, the London bombings of July 2005, and now the Ukraine invasion. For those looking for some kind of consolation right now, the index reckons that we are still not close to the level of geopolitical risk that we saw in the aftermath of 9/11.
The geopolitical risk index

High geopolitical risk has been shown to increase investors’ uncertainty, prompting declines in stock prices and other financial assets. The link with stock market uncertainty is particularly clear in the graph below, which compares the GPR to the VIX indicator of stock market volatility, which is sometimes referred to as the “investors’ fear gauge”.
The GPR daily is in orange, while there are two other versions that track risk of threat (red) and geopolitical acts (green). Essentially they have all been moving in the same direction, with the red risk line leading the way. As you can see, both these lines and the VIX rose in November after satellite imagery first showed build-ups of Russian troops on the border with Ukraine. Other peaks correspond to January 26, which was the date of Nato’s written response to the Russians, and the start of the invasion on February 24.
Geopolitical risk vs stock market volatility
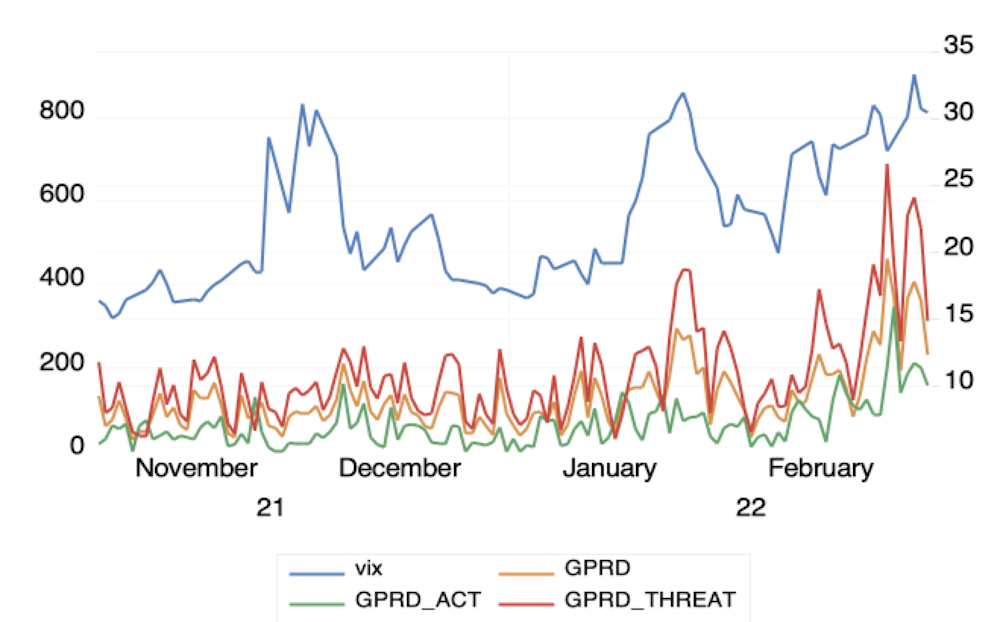
GPRD (orange) = GPR daily; GPRD_Act (green) = geopolitical acts; GPRD_Threat (red) = geopolitical threats. Authors provided
The commodity surge
Energy markets, and oil in particular, react to geopolitical risk at the best of times. And given Russia’s huge importance as an oil exporter, energy prices have been particularly affected by this war. Brent crude is currently trading at around US$116 (£88) per barrel, having risen over US$130 a couple of days ago. This will impact everything from firms’ cash flows to consumer petrol prices, creating inflationary pressure that helps to bring about recessions.
Because Russia and Ukraine are also major exporters of many other important commodities such as wheat, neon gas, palladium and sunflower oil, their prices have been soaring too – and they’re destined to keep increasing due to western sanctions.
Commodity and asset prices compared since invasion
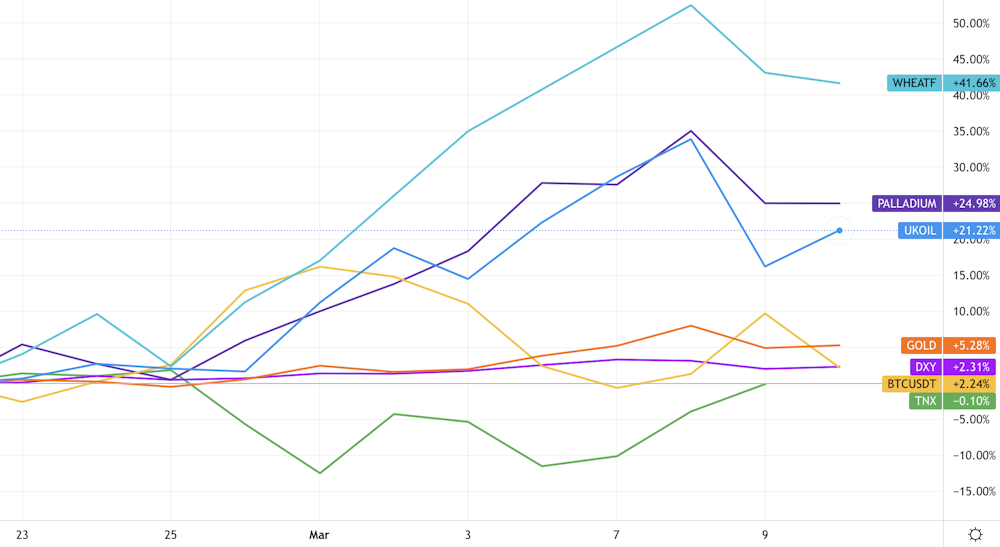
Brent crude = blue; wheat futures = cyan; palladium = indigo; gold = orange; bitcoin = yellow; US dollar (DXY) = purple; 10yr US Treasury bonds = green. Trading View
On the other hand, safe havens in times of volatility have been doing well. The price of gold is up again after its remarkable uptick in the early months of the pandemic. Bitcoin and other cryptocurrencies have the potential to benefit since they are a possible vehicle for Russians to circumvent sanctions, but they have been more subdued lately.
Stock markets
The response of stock markets to the war is more complex, given that different markets have more or less exposure to different commodities than others. They also have different levels of exposure to the Russian stock market (which remains closed after plunging together with the rouble following the invasion).
According to our calculations from data that dates back to 1985, European countries are more correlated to the Russian market and therefore more vulnerable. For example, France, Germany and the UK have a 0.45, 0.42 and 0.47 correlation with Russia, where 1 would mean they moved in lockstep and 0 that they did not influence each other at all. The US, on the other hand, has an 0.26 correlation, while China’s, interestingly, is just 0.1. This all broadly corresponds to how different stork markets have performed since the invasion, as you can see below.
Stock markets compared

FTSE 100 (UK) = blue; S&P 500 (US) = orange; Toronto Stock Exchange (Canada) = cyan; CAC 40 (France) = yellow; DE40 (Germany) = indigo; Shanghai Stock Exchange = green; MOEX (Russia) = purple. Trading View
Finally, what about different types of companies? As you can see below in this breakdown of US players, different sectors have performed quite differently in the early stages of this crisis. The black line is the S&P 500, so those below have underperformed and those above have done better.
Energy companies have been doing very well, for example (as have weapons makers). Companies that either sell consumer staples or consumer products that are more discretionary, ranging from hifi equipment to cinema tickets, have been losing out amid fears that they will have less to spend because of commodity inflation.
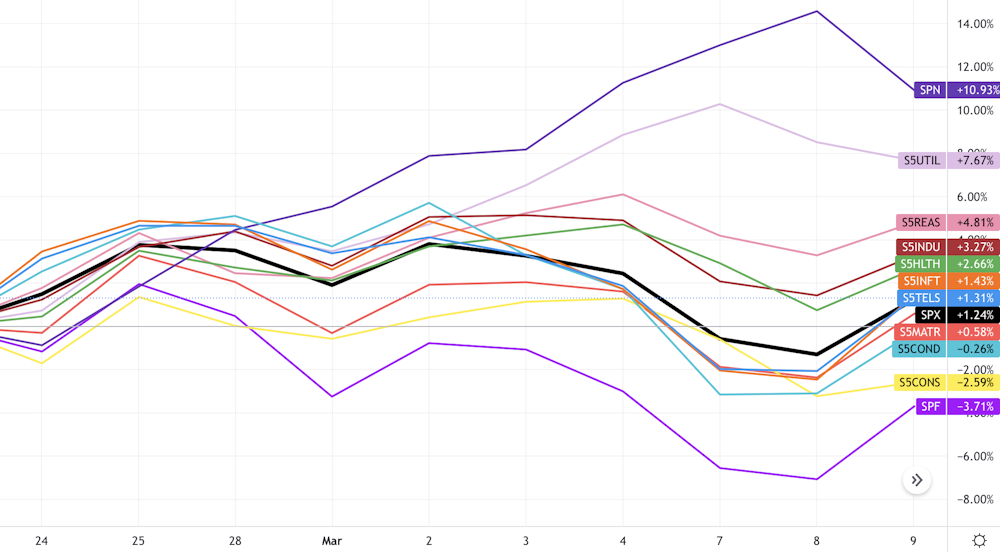
Communications = blue; consumer discretionary = cyan; consumer staples = yellow; energy = indigo; financials = purple; healthcare = green; industrials = dark red; IT = orange; materials = red; real estate = pink; utilities = lilac; S&P 500 = black. Trading View
We shouldn’t be fooled into thinking that some sectors are simply going to benefit from the war, however. There can be short-run winners, but the interconnectedness of economies, the burden of sanctions and the costs of increased uncertainty will eventually bite all markets. It’s going to affect household budgets, wages and also pensions – regardless of the final outcome, which remains largely unpredictable.


