


- News

- Economy

- Central Banks
- Investing
- Research
- Roundups
- Digital Currency
- Insights
- Technical Analysis
- Technology
- Business
- Law
- Health
- Nature
- Fintech
- Science
- Topic
- Opinions
- ©Econometrics LLC . All Rights Reserved.
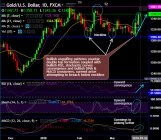
Mar 26, 2018 09:36 am UTC| Technicals
The gold (XAUUSD) on daily terms: Bullish engulfing patterns have occurred at 1332.05 and 1347.12 levels that counter the previous formation of the double top. These bullish patterns have occurred after testing strong...

FxWirePro: GBP/AUD struggles at 200W SMA at 1.8378, further upside only on break above
Mar 26, 2018 09:25 am UTC| Technicals
GBP/AUD is trading in a Rising Wedge pattern and price has shown a break above Wedge Top at 1.8295 in last weeks trade. The pair is currently trading in an extremely narrow range and finds major resistance at 200W SMA...

FxWirePro: AUD/CAD tests channel base support, decisive break below required for further downside
Mar 26, 2018 08:32 am UTC| Technicals
AUD/CAD tests channel base support at 0.9925, hits lowest since Feb 27th. Downside has held above 0.99 handle, break below will see further weakness. The pair has paused 7 straight sessions of downside and is...
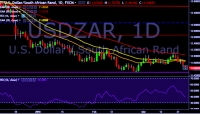
FxWirePro: USD/ZAR hits fresh 4-week low at 11.60 mark, stay bearish
Mar 26, 2018 08:27 am UTC| Technicals
USD/ZAR is currently trading around 11.63 levels. It made intraday high at 11.70 and low at 11.60 levels. Intraday bias remains bearish till the time pair holds key resistance at 11.92 mark. A daily close...
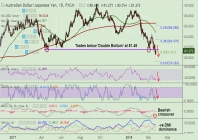
FxWirePro: AUD/JPY recovers from 14-month lows at 80.50, finds stiff resistance at 81.48
Mar 26, 2018 07:33 am UTC| Technicals
AUD/JPY edges higher from 14-month lows at 80.50, hovers around 5-DMA at 81.42. The pair is trading 0.97% higher on the day as risk-recovery knocks-off demand for the Yen. The pair finds strong resistance at...
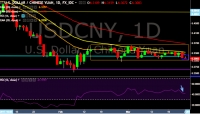
FxWirePro: Chinese yuan continues to trade flat, PBOC sets yuan mid-point at 6.3193 per U.S. dollar
Mar 26, 2018 07:13 am UTC| Technicals
USD/CNY is currently trading around 6.3087 marks. It made intraday high at 6.3159 and low at 6.3072 levels. Intraday bias remains neutral till the time pair holds key support at 6.3110 marks. A sustained...
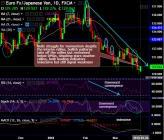
Mar 26, 2018 06:43 am UTC| Technicals Insights & Views
Chart and candlestick pattern formed- Bearish RSI divergence, shooting stars at 130.417 on daily terms and 132.336 levels on monthly terms. Hanging man patterns at 135.157 and 135.523 levels on the monthly chart, bearish...


South Africa Eyes ECB Repo Lines as Inflation Eases and Rate Cuts Loom

Russian Stocks End Mixed as MOEX Index Closes Flat Amid Commodity Strength

China Extends Gold Buying Streak as Reserves Surge Despite Volatile Prices

Trump Lifts 25% Tariff on Indian Goods in Strategic U.S.–India Trade and Energy Deal

Trump Signs Executive Order Threatening 25% Tariffs on Countries Trading With Iran


New York Legalizes Medical Aid in Dying for Terminally Ill Patients

Trump Says “Very Good Talks” Underway on Russia-Ukraine War as Peace Efforts Continue

China Warns US Arms Sales to Taiwan Could Disrupt Trump’s Planned Visit

Trump Allows Commercial Fishing in Protected New England Waters

SpaceX Prioritizes Moon Mission Before Mars as Starship Development Accelerates

NASA and SpaceX Target Crew-11 Undocking From ISS Amid Medical Concern

Neuralink Plans High-Volume Brain Implant Production and Fully Automated Surgery by 2026

Jared Isaacman Confirmed as NASA Administrator, Becomes 15th Leader of U.S. Space Agency
Senate Sets December 8 Vote on Trump’s NASA Nominee Jared Isaacman
Nvidia CEO Jensen Huang Says AI Investment Boom Is Just Beginning as NVDA Shares Surge

Amazon Stock Rebounds After Earnings as $200B Capex Plan Sparks AI Spending Debate

Global PC Makers Eye Chinese Memory Chip Suppliers Amid Ongoing Supply Crunch

OpenAI Expands Enterprise AI Strategy With Major Hiring Push Ahead of New Business Offering

SoftBank Shares Slide After Arm Earnings Miss Fuels Tech Stock Sell-Off


- Market Data


