


- News

- Economy

- Central Banks
- Investing
- Research
- Roundups
- Digital Currency
- Insights
- Technical Analysis
- Technology
- Business
- Law
- Health
- Nature
- Fintech
- Science
- Topic
- Opinions
- ©Econometrics LLC . All Rights Reserved.
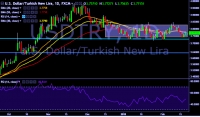
FxWirePro: USD/TRY exhibits range bound movement, faces strong resistance 3.8190 mark
Feb 20, 2018 08:27 am UTC| Technicals
USD/TRY is currently trading at 3.7706 levels. It made intraday high at 3.7727 and low at 3.7563 levels. Intraday bias remains bullish till the time pair holds key support at 3.7399 levels. Key resistances...

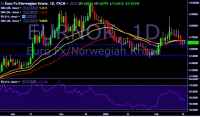
FxWirePro: EUR/NOK trades in narrow range, stay bearish
Feb 20, 2018 07:47 am UTC| Technicals
EUR/NOK is currently trading at 9.6538 levels. It made intraday high at 9.6680 and low at 9.6441 levels. Intraday bias remains neutral till the time pair holds key support at 9.6484 mark. A sustained break...
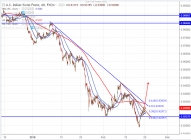
FxWirePro: USD/CHF breaks trend line resistance at 0.9310, good to buy on dips
Feb 20, 2018 06:53 am UTC| Technicals
USD/CHF has shown a good recovery of almost 133 pips from the low of 0.91876 made on Friday. The pair broken trend line resistance at 0.9310 and jumped till 0.93198. It is currently trading around...
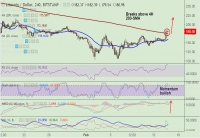
FxWirePro: LTC/USD breaks out of daily cloud, good to go long on dips
Feb 20, 2018 06:46 am UTC| Technicals Digital Currency
LTC/USD has shown a breakout at daily Ichimoku cloud, bias higher. Technical indicators support further upside in the pair. Momentum studies are bullish and MADC has edges into positive territory. ADX is...
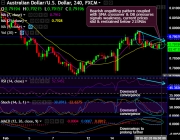
Feb 20, 2018 06:34 am UTC| Research & Analysis Technicals
Chart and candlestick pattern formed: Bearish engulfing long-legged doji candlesticks on the intraday chart (refer 4H chart) and the potential double top pattern has occurred on weekly plotting. Bearish engulfing and...


South Africa Eyes ECB Repo Lines as Inflation Eases and Rate Cuts Loom

Russian Stocks End Mixed as MOEX Index Closes Flat Amid Commodity Strength

China Extends Gold Buying Streak as Reserves Surge Despite Volatile Prices

Trump Lifts 25% Tariff on Indian Goods in Strategic U.S.–India Trade and Energy Deal

Trump Signs Executive Order Threatening 25% Tariffs on Countries Trading With Iran


New York Legalizes Medical Aid in Dying for Terminally Ill Patients

Trump Says “Very Good Talks” Underway on Russia-Ukraine War as Peace Efforts Continue

China Warns US Arms Sales to Taiwan Could Disrupt Trump’s Planned Visit

Trump Allows Commercial Fishing in Protected New England Waters

SpaceX Prioritizes Moon Mission Before Mars as Starship Development Accelerates

NASA and SpaceX Target Crew-11 Undocking From ISS Amid Medical Concern

Neuralink Plans High-Volume Brain Implant Production and Fully Automated Surgery by 2026

Jared Isaacman Confirmed as NASA Administrator, Becomes 15th Leader of U.S. Space Agency
Senate Sets December 8 Vote on Trump’s NASA Nominee Jared Isaacman
Nvidia CEO Jensen Huang Says AI Investment Boom Is Just Beginning as NVDA Shares Surge

Amazon Stock Rebounds After Earnings as $200B Capex Plan Sparks AI Spending Debate

Global PC Makers Eye Chinese Memory Chip Suppliers Amid Ongoing Supply Crunch

OpenAI Expands Enterprise AI Strategy With Major Hiring Push Ahead of New Business Offering

SoftBank Shares Slide After Arm Earnings Miss Fuels Tech Stock Sell-Off


- Market Data


