


- News

- Economy

- Central Banks
- Investing
- Research
- Roundups
- Digital Currency
- Insights
- Technical Analysis
- Technology
- Business
- Law
- Health
- Nature
- Fintech
- Science
- Topic
- Opinions
- ©Econometrics LLC . All Rights Reserved.
USD/CHF forms bullish divergence in daily Chart, slight jump till 0.9500 likely
Jul 24, 2017 09:48 am UTC| Technicals
Intraday trend Slightly Bullish Pattern formed Bullish Divergence USD/CHF declined slightly below major support 0.9440 and slightly jumped from that level. It is currently trading around 0.94550. The...

FxWirePro: AUD/NZD finds strong support at 200-DMA, weakness only on break below
Jul 24, 2017 09:11 am UTC| Technicals
AUD/NZD retraces brief dip below 200-DMA at 1.0611, intraday bias higher. The pair has reclaimed the 1.07 handle after breaking above 100-DMA at 1.0987. Price action has reversed dip into daily cloud and cloud...
Jul 24, 2017 07:22 am UTC| Technicals
Bearish AUD scenarios: 1) The unemployment rate breaks above 6%, forcing the RBA to respond more aggressively to weak inflation 2) The Fed responds to animal spirits and bullish survey data by delivering a faster...
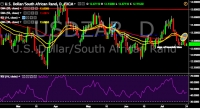
FxWirePro: USD/ZAR remains well supported below 13.00 mark, good to sell on rallies
Jul 24, 2017 07:21 am UTC| Technicals
USD/ZAR is currently trading around 12.93 levels. It made intraday high at 12.94 and low at 12.87 levels. Intraday bias remains neutral till the time pair holds key support at 12.87 mark. A daily close...

FxWirePro: EUR/CAD fails to break above 4H 100-SMA, good to go short on rallies
Jul 24, 2017 07:11 am UTC| Technicals
EUR/CAD has failed to show a decisive break above 4H 100-SMA currently at 1.4664. We see scope for test of trendline support at 1.4480 levels. Technical indicators on 4-hourly charts are bearishly aligned. Stochs...
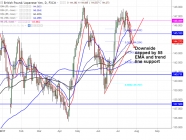
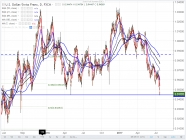
FxWirPro: GBP/JPY downside capped by 55- EMA, good to buy on dips
Jul 24, 2017 07:09 am UTC| Technicals
Major support 144 (55 EMA and trend line support). GBP/JPY has taken support near trend line and 55- day EMA and recovered slightly from that level. The pair jumped till 144.66 and is currently trading around...

Jul 24, 2017 06:46 am UTC| Technicals
Both bullish bearish flag pattern occurred, the current prices are well above SMAs but no momentum is observed (4H chart). For now, bearish flag pattern is visible on 4H chart, it is now attempting to break below a...


China Extends Gold Buying Streak as Reserves Surge Despite Volatile Prices

Trump Lifts 25% Tariff on Indian Goods in Strategic U.S.–India Trade and Energy Deal

Trump Signs Executive Order Threatening 25% Tariffs on Countries Trading With Iran

U.S.-India Trade Framework Signals Major Shift in Tariffs, Energy, and Supply Chains

Dow Hits 50,000 as U.S. Stocks Stage Strong Rebound Amid AI Volatility


New York Legalizes Medical Aid in Dying for Terminally Ill Patients

Trump Says “Very Good Talks” Underway on Russia-Ukraine War as Peace Efforts Continue

China Warns US Arms Sales to Taiwan Could Disrupt Trump’s Planned Visit

Trump Allows Commercial Fishing in Protected New England Waters

SpaceX Prioritizes Moon Mission Before Mars as Starship Development Accelerates

NASA and SpaceX Target Crew-11 Undocking From ISS Amid Medical Concern

Neuralink Plans High-Volume Brain Implant Production and Fully Automated Surgery by 2026

Jared Isaacman Confirmed as NASA Administrator, Becomes 15th Leader of U.S. Space Agency
Senate Sets December 8 Vote on Trump’s NASA Nominee Jared Isaacman
Nvidia CEO Jensen Huang Says AI Investment Boom Is Just Beginning as NVDA Shares Surge

Amazon Stock Rebounds After Earnings as $200B Capex Plan Sparks AI Spending Debate

Global PC Makers Eye Chinese Memory Chip Suppliers Amid Ongoing Supply Crunch

OpenAI Expands Enterprise AI Strategy With Major Hiring Push Ahead of New Business Offering

SoftBank Shares Slide After Arm Earnings Miss Fuels Tech Stock Sell-Off


- Market Data


