


- News

- Economy

- Central Banks
- Investing
- Research
- Roundups
- Digital Currency
- Insights
- Technical Analysis
- Technology
- Business
- Law
- Health
- Nature
- Fintech
- Science
- Topic
- Opinions
- ©Econometrics LLC . All Rights Reserved.
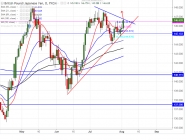
FxWirePro: GBP/JPY faces strong trend resistance at 146.75, break above targets 148.10
Aug 02, 2017 12:57 pm UTC| Technicals
Major support 145.30 (Trend line joining 138.67 and 139.20). GBP/JPY formed a minor bottom around 144.80 on Jul 31st 2017 and recovered slightly from that level. It has declined till 146.66. The pair is facing...
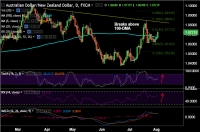
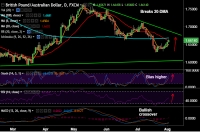
FxWirePro: AUD/NZD breaks 100-DMA at 1.0671, eyes trendline at 1.0830, stay long
Aug 02, 2017 12:05 pm UTC| Technicals
Kiwi slumps across the board after worse-than expected NZ jobs data which saw unemployment drop to 4.8 percent. However, the participation rate fell 0.6 percentage points to 70.0 percent, the labour force contracted...
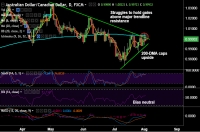
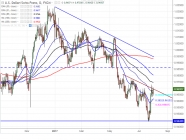
FxWirePro: AUD/CAD fails to hold break above major trendline resistance at 1.0015, bias neutral
Aug 02, 2017 11:36 am UTC| Technicals
AUD/CAD struggles at major trendline resistance at 1.0015, bias remains neutral. Spinning top formation seen on Tuesdays and Wednesdays trade till now. The pair is currently trading at 0.9992 after hitting highs...
FxWirePro: EUR/USD downside capped by 5- day MA, good to buy on dips
Aug 02, 2017 10:55 am UTC| Technicals
EURUSD has broken 18 month high of 1.18455 made yesterday and jumped till 1.18680 at the time of writing. The pair declined till 1.17850 yesterday on account of profit booking. It is currently trading around 1.18336 0.27%...
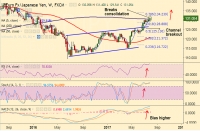
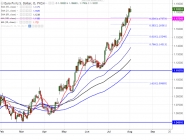
FxWirePro: EUR/JPY breaks consolidation, takes out 131 handle to hit fresh 18-month high at 131.40
Aug 02, 2017 10:49 am UTC| Technicals
EUR/JPY edges lower from fresh 18-month high at 131.40, is currently trading at 131.07. The major has broken out of consolidation phase in which it was confined since start of July. Upside has broken above weekly...
FxWirePro: USD/CHF consolidates in narrow range, good to buy on dips
Aug 02, 2017 10:01 am UTC| Technicals
USD/CHF consolidates below 0.97260 and intraday bias is still neutral. The pair should break above 0.97260 for minor bullishness. Minor trend is bullish as long as support 0.9590 holds. Any break below will drag the...
FxWirePro: GBP/AUD holds above 1.66 handle after UK construction PMI miss, bias higher, stay long
Aug 02, 2017 09:07 am UTC| Technicals
The latest manufacturing PMI reading had fuelled lingering hopes of a hawkish BoE surprise tomorrow. But big miss on UK construction PMI today dents hopes for a hawkish surprise. Data released earlier today...


BCA Research Warns U.S.-Iran Ceasefire Could Collapse, Maintains Cautious Equity Outlook

U.S. Natural Gas Market Faces Short-Term Pressure but Long-Term Demand Surge

Chinese Brands Are Taking Over Brazil — And It's Just Getting Started

Bank of America Maintains Forecast for Two Fed Rate Cuts in 2026 Despite Inflation Risks

Trump Claims Oil Tankers Heading to U.S. Amid Iran War and Strait of Hormuz Crisis

U.S.-Iran Peace Talks in Islamabad Pause With Key Differences Unresolved

Islamabad at a Standstill as U.S.-Iran Peace Talks Take Center Stage

Costa Rica Receives First Wave of U.S.-Deported Migrants Under New Bilateral Agreement

U.S.-Iran Nuclear Talks Resume in Islamabad Amid Strait of Hormuz Standoff

Trump Warns China Over Iran Arms as Diplomatic Talks Intensify

China vs. NASA: The New Moon Race and What's at Stake by 2030


NASA's Artemis II Mission: First Crewed Lunar Journey Since Apollo

NASA's Artemis II Crew Arrives in Florida for Historic Moon Mission
SpaceX Pivots Toward Moon City as Musk Reframes Long-Term Space Vision

OpenAI Addresses Security Vulnerability in macOS App Certification Process

San Francisco Suspect Arrested After Molotov Cocktail Attack on OpenAI CEO Sam Altman's Home

SanDisk Joins Nasdaq-100, Replacing Atlassian on April 20

TSMC Posts Strong Q1 2025 Revenue, Riding AI Chip Demand Wave

Lumentum Holdings Rides AI Wave With Order Book Filled Through 2028


- Market Data


