


 World Cup technology: from ref cams to AI analysts, cutting-edge research is changing the game
  With Iran and the US signing a peace deal, where does that leave Benjamin Netanyahu?
  Morgan Stanley Sees Chinese Auto Market Recovery Gaining Momentum in Late Summer
  J.P. Morgan Sees Potential Vestas Guidance Upgrade Amid Strong Wind Energy Demand
  Today’s space race could turn fatal if we don’t agree on new rules
  China’s AI Manufacturing Boom Masks Weak Consumer Economy, Citi Says
  Sell the Bounce": Gold Rally Stalls Near $4165 as Fed Hawks Slam the Door on Rate Cuts — Targets $4000/$3600
  Trump’s Iran Strategy: What Has Been Achieved After Three Months of Conflict?
  Gold Surges Above Key EMAs, Bulls Eye Resistance Amidst Bullish Momentum


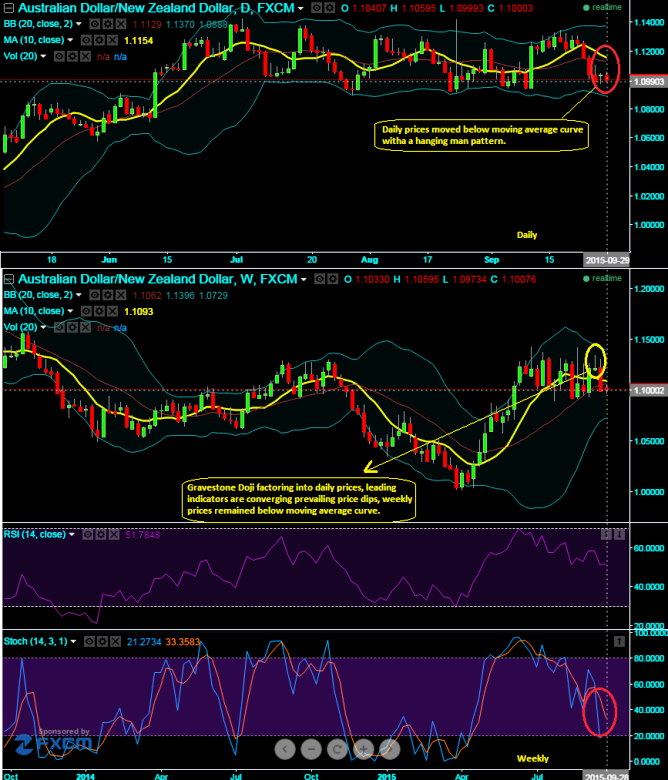
We maintain our bearish stance on this pair as the prices both on weekly and daily patterns have been well below moving average curve that signals us long term bearish trend is on the cards.
The pair has pretty much achieved our earlier target at 1.1317, we could now foresee and maintain our next target for this pair is at 1.0937 levels towards south.
RSI is currently trending near 44.5079, while %D crossover on slow stochastic above 70 levels signifies bearish momentum is continuing. Last month's diagonal strips have taken care of upswings and downswings and yielded handsome returns and we are firm onto continue with the same.
We traced out bearish gravestone doji pattern around 1.1218 levels on weekly charts in earlier post, and leading oscillators to substantiate current price fluctuations. Now the rest all is history and the current prices have shown their impact of this bearish candle pattern.

- News

- Economy

- Central Banks
- Investing
- Research
- Roundups
- Digital Currency
- Insights
- Technical Analysis
- Technology
- Business
- Law
- Health
- Nature
- Fintech
- Science
- Topic
- Opinions
- ©Econometrics LLC . All Rights Reserved.
FXWirePro: AUD/NZD extensive downswings most likely on a signal by lagging indicator after gravestone doji formation
Tuesday, September 29, 2015 7:47 AM UTC
Editor's Picks


- Market Data
Most Popular


