
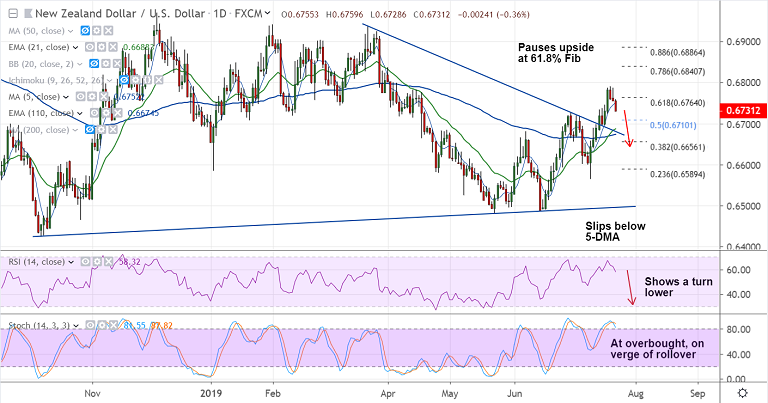
NZD/USD chart - Trading View
NZD/USD is extending weakness for the 3rd straight session.
The pair was trading 0.33% lower on the day at 0.6733 at 07:00 GMT.
Price action is edging lower after testing Upper Bollinger band and has slipped below 5-DMA.
Technical indicators are turning slightly bearish. Stochs are at overbought and on verge of rollover into neutral.
RSI has turned south and bearish inverted hammer adds to the downside pressure.
200-DMA is major support at 0.6719. Breach below will open up downside. Next major support lies at 55-EMA at 0.6656.
Support levels - 0.6719 (200-DMA), 0.6674 (110-EMA), 0.6656 (55-EMA)
Resistance levels - 0.6752 (5-DMA), 0.6786 (Upper BB), 0.68
For details on FxWirePro's Currency Strength Index, visit http://www.fxwirepro.com/currencyindex.


