


- News

- Economy

- Central Banks
- Investing
- Research
- Roundups
- Digital Currency
- Insights
- Technical Analysis
- Technology
- Business
- Law
- Health
- Nature
- Fintech
- Science
- Topic
- Opinions
- ©Econometrics LLC . All Rights Reserved.
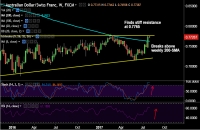
FxWirePro: AUD/CHF finds stiff resistance at 0.7765, bias higher, stay long
Jul 31, 2017 12:13 pm UTC| Technicals
AUD/CHF halts 5 consecutive sessions of gains, down 0.08% on the day. The pair finds stiff resistance at 0.7765 (trendline), break above could see further upside. Technical indicators on weekly charts are highly...
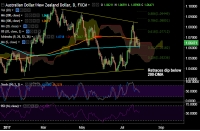
FxWirePro: AUD/NZD pivotal around 200-DMA at 1.0611, weakness only on decisive break below
Jul 31, 2017 11:36 am UTC| Technicals
AUD/NZD has retraced brief dip below 200-DMA at 1.0611, decisive break below will confirm weakness. Upside finds stiff resistance at weekly 100-SMA at 1.0683, pair struggling to close above from last 2...

Jul 31, 2017 11:26 am UTC| Technicals
Major support 144.80 (Trend line joining 138.67 and 139.20). GBP/JPY formed a minor top around 146.55 on Jun 27th 2017 and declined slightly from that level. It has declined till 145.08. The pair is trading...

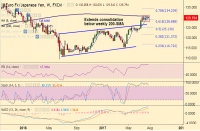
FxWirePro: EUR/USD downside capped by 7- day MA,good to buy on dips
Jul 31, 2017 10:51 am UTC| Technicals
EUR/USD has formed a minor bottom around 1.16500 on Jul 27th 2017 low and recovered from that level. The pair jumped till 1.17640 yesterday. It is currently trading around 1.17310. Market awaits major US economic data...
FxWirePro: EUR/JPY finds strong support at 129.55 (20-DMA), good to go short on break below
Jul 31, 2017 10:45 am UTC| Technicals
EUR/JPY slips lower on the day, remains depressed despite upbeat EZ core CPI surprise. Eurozone flash annual CPI reading came in unchanged 1.3% in July, matching the consensus forecast. The core figures surprised...
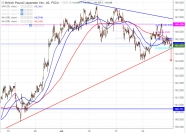
FxWirePro: Sell GBP/JPY below 144.80
Jul 31, 2017 09:39 am UTC| Technicals
Major support 144.80 (Trend line joining 138.67 and 139.20). GBP/JPY formed a minor top around 146.55 on Jun 27th 2017 and declined slightly from that level. It has declined till 145.12. The pair is trading...
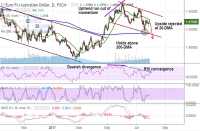
FxWirePro: EUR/AUD rejected at 20-DMA, further upside only on break above
Jul 31, 2017 09:25 am UTC| Technicals
EUR/AUD remains capped below stiff resistance at 20-DMA at 1.4769. The pair is trading in a slopping channel and RSI is now converging with price action. 100-DMA at 1.4601 is strong support on the downside, we see...


South Africa Eyes ECB Repo Lines as Inflation Eases and Rate Cuts Loom

Russian Stocks End Mixed as MOEX Index Closes Flat Amid Commodity Strength

China Extends Gold Buying Streak as Reserves Surge Despite Volatile Prices

Trump Lifts 25% Tariff on Indian Goods in Strategic U.S.–India Trade and Energy Deal

Trump Signs Executive Order Threatening 25% Tariffs on Countries Trading With Iran


New York Legalizes Medical Aid in Dying for Terminally Ill Patients

Trump Says “Very Good Talks” Underway on Russia-Ukraine War as Peace Efforts Continue

China Warns US Arms Sales to Taiwan Could Disrupt Trump’s Planned Visit

Trump Allows Commercial Fishing in Protected New England Waters

SpaceX Prioritizes Moon Mission Before Mars as Starship Development Accelerates

NASA and SpaceX Target Crew-11 Undocking From ISS Amid Medical Concern

Neuralink Plans High-Volume Brain Implant Production and Fully Automated Surgery by 2026

Jared Isaacman Confirmed as NASA Administrator, Becomes 15th Leader of U.S. Space Agency
Senate Sets December 8 Vote on Trump’s NASA Nominee Jared Isaacman
Nvidia CEO Jensen Huang Says AI Investment Boom Is Just Beginning as NVDA Shares Surge

Amazon Stock Rebounds After Earnings as $200B Capex Plan Sparks AI Spending Debate

Global PC Makers Eye Chinese Memory Chip Suppliers Amid Ongoing Supply Crunch

OpenAI Expands Enterprise AI Strategy With Major Hiring Push Ahead of New Business Offering

SoftBank Shares Slide After Arm Earnings Miss Fuels Tech Stock Sell-Off


- Market Data


