


- News

- Economy

- Central Banks
- Investing
- Research
- Roundups
- Digital Currency
- Insights
- Technical Analysis
- Technology
- Business
- Law
- Health
- Nature
- Fintech
- Science
- Topic
- Opinions
- ©Econometrics LLC . All Rights Reserved.
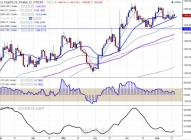
FxWirePro: Gold faces strong resistance at $1358, good to sell on rallies
Aug 17, 2016 06:31 am UTC| Technicals
Major resistance - $1368. Major support - $1330. The yellow metal has once again retreated till $1340 at the time of writing after making a high of $1357.96 yesterday and it is currently trading at...
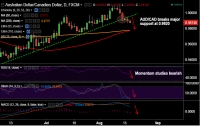
FxWirePro: AUD/CAD breaks major support at 0.9920, scope for drop till 0.9775
Aug 17, 2016 06:30 am UTC| Technicals
AUD/CAD has broken major trendline support at 0.9920, intraday bias lower. Technical indicators support downside in the pair. RSI and Stochs are biased lower, MACD shows a bearish crossover. Major support on the...
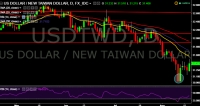
Aug 17, 2016 06:03 am UTC| Technicals
USD/TWD is currently trading around 31.42 marks. It made intraday high at 31.51 and low at 31.21 marks. Intraday bias remains bullish till the time pair holds key support at 31.21 marks. A sustain close...
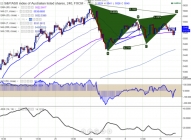
FxWirePro: ASX200 faces strong resistance at 5600, good to sell on rallies
Aug 17, 2016 05:53 am UTC| Technicals
Pattern formed- Bearish Gartley pattern. Potential reversal Zone (PRZ) -5600. The index has once again declined after making a high of 5559 yesterday. It is currently trading around 5538. On the higher side,...
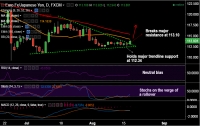
FxWirePro: EUR/JPY breaks major resistance at 113.10, gains till 114.80 likely
Aug 17, 2016 05:42 am UTC| Technicals
EUR/JPY turns positive after holding strong trendline support at 112.34 levels. On the upside the pair has broken major resistance at 113.10, intraday bias higher. We see scope for test of 114.18 (20-DMA) levels....
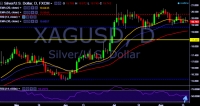
FxWirePro: Prefer to go short on XAG/USD at 19.80 and target of $19.47
Aug 17, 2016 05:34 am UTC| Technicals
XAG/USD is currently trading around $19.75 marks. It made intraday high at $19.87 and low at $19.74 levels. Intraday bias remains bearish till the time pair holds key resistance at $20.05 levels. A daily...
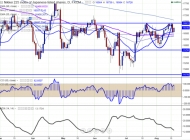
Aug 17, 2016 05:28 am UTC| Technicals
Pattern Formed Cup and Handle Major resistance- 17000 Nikkei225 has slightly regained after making a low of 16514. It is currently trading around 16714. The index should break the psychological resistance...


U.S. Stock Futures Steady Amid Iran Ceasefire Talks and Trump Address

Trump Claims Iran Sought Ceasefire as Middle East War Escalates

Oil Prices Slide as Iran Tensions Ease and U.S. Crude Stockpiles Swell

Gold Prices Surge as U.S.-Iran Ceasefire Talks Spark Market Optimism

South Korea's Inflation Rises Modestly in March Amid Oil Price Pressures

Congress Eyes Two-Bill Strategy to Resolve DHS Funding Crisis
Trump's Claim That the U.S. Can Cover Global Jet Fuel Shortfall Doesn't Add Up

FBI Launches Independent Cuba Probe After Deadly Speedboat Shootout

Carney and Trump Discuss Middle East Crisis in High-Stakes Phone Call

Bahamas Calls Snap Election for May 12 Amid Cost of Living Concerns

NASA's Artemis II Mission: First Crewed Lunar Journey Since Apollo

NASA's Artemis II Crew Arrives in Florida for Historic Moon Mission

SpaceX Pivots Toward Moon City as Musk Reframes Long-Term Space Vision

SpaceX Prioritizes Moon Mission Before Mars as Starship Development Accelerates

NASA and SpaceX Target Crew-11 Undocking From ISS Amid Medical Concern
SpaceX Eyes Historic IPO at $1.75 Trillion Valuation

Annie Altman Amends Sexual Abuse Lawsuit Against OpenAI CEO Sam Altman

TSMC Japan's Second Fab to Produce 3nm Chips by 2028

Apple Turns 50: From Garage Startup to AI Crossroads

Rubio Directs U.S. Diplomats to Use X and Military Psyops to Counter Foreign Propaganda


- Market Data


