


- News

- Economy

- Central Banks
- Investing
- Research
- Roundups
- Digital Currency
- Insights
- Technical Analysis
- Technology
- Business
- Law
- Health
- Nature
- Fintech
- Science
- Topic
- Opinions
- ©Econometrics LLC . All Rights Reserved.
AUD/USD is trading well below cloud, good to sell on rallies
May 20, 2015 09:33 am UTC| Technicals
RES 4: 0.8062 (Support turned into resistance) RES 3: 0.7985 (200 day HMA) RES2: 0.7940 (Kijun-Sen) RES 1: 0.7915 (20 day HMA) PRICE: 0.7894 @ 09:06 GMT SUP 1:0.7860 (May 8th low) SUP 2...
EUR/USD breaks 38.2%, eyes next retracement
May 20, 2015 06:55 am UTC| Technicals
Through the 1.1106 38.2%Fibonacci of the 1.0521/1.1468 rise The 50% is at 1.0994 and is by the daily cloud base at 1.10996 Attempts to lift capped by the 21 DMA, now at 1.1150, 1.1153 the...
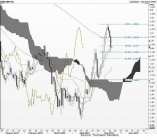
GBP/USD daily close under the 200 DMA signals further corrective action
May 20, 2015 06:12 am UTC| Technicals
Spot stalled by 50% of 1.5088/1.5815 at 1.5452 yesterday, closed above The 10/200 DMAs are about to converge at 1.5589/90, offer at 1.5595 Break below that 50% would open up 61.8% retracement of rally at...
USD/JPY breaks short term resistance 120.80, jump till 122 cannot be ruled out
May 20, 2015 05:46 am UTC| Technicals
RES4: 124.13 (2007 High) RES3:123.41 (138.2% retracement of 122.01 and 118.32) RES2: 122.05 (Mar 3rd high) RES1 121.49 (161.8% retracement of 120.49 and 118.87) PRICE: 120.90 @ 05:43 GMT SUP1: 120.50...
EUR/AUD suggests mix signals and consolidation
May 20, 2015 03:19 am UTC| Technicals
Dip turned technical signals from positive to neutral 5, 10 20 dmas conflict, 20 day Bollingers contract - suggests consolidation Initial resistance is seen at 1.4100 and support at 1.3909...
USD/JPY eyes on 121.00 breaks, stops above now seen larger than initially expected
May 20, 2015 03:07 am UTC| Technicals
Pair down from 120.98 Tokyo fixes high, 121.00 option KO defence talk 120.79 extent of retracement so far however, pair still buoyant. Next resistance levels are seen at 121.20, 121.50 and...
USD/IDR supported by state banks statement
May 20, 2015 02:59 am UTC| Technicals
Pair traded 13165-13180 range but state banks once again cited on top Dips remain limited, as higher DXY, strong US housing data supports Pair last at 13165-13170, NDFs 13260-290; JKSE...


India–U.S. Interim Trade Pact Cuts Auto Tariffs but Leaves Tesla Out

Trump’s Inflation Claims Clash With Voters’ Cost-of-Living Reality

South Africa Eyes ECB Repo Lines as Inflation Eases and Rate Cuts Loom

Russian Stocks End Mixed as MOEX Index Closes Flat Amid Commodity Strength

China Extends Gold Buying Streak as Reserves Surge Despite Volatile Prices

Jack Lang Resigns as Head of Arab World Institute Amid Epstein Controversy

US Pushes Ukraine-Russia Peace Talks Before Summer Amid Escalating Attacks

Netanyahu to Meet Trump in Washington as Iran Nuclear Talks Intensify

Trump Backs Nexstar–Tegna Merger Amid Shifting U.S. Media Landscape

Japan Election 2026: Sanae Takaichi Poised for Landslide Win Despite Record Snowfall

SpaceX Prioritizes Moon Mission Before Mars as Starship Development Accelerates

NASA and SpaceX Target Crew-11 Undocking From ISS Amid Medical Concern

Neuralink Plans High-Volume Brain Implant Production and Fully Automated Surgery by 2026

Jared Isaacman Confirmed as NASA Administrator, Becomes 15th Leader of U.S. Space Agency
Senate Sets December 8 Vote on Trump’s NASA Nominee Jared Isaacman
Nvidia CEO Jensen Huang Says AI Investment Boom Is Just Beginning as NVDA Shares Surge

Amazon Stock Rebounds After Earnings as $200B Capex Plan Sparks AI Spending Debate

Global PC Makers Eye Chinese Memory Chip Suppliers Amid Ongoing Supply Crunch

OpenAI Expands Enterprise AI Strategy With Major Hiring Push Ahead of New Business Offering

SoftBank Shares Slide After Arm Earnings Miss Fuels Tech Stock Sell-Off


- Market Data


