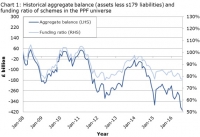
Chart of the Day: Ballooning Pension Deficit
Aug 09, 2016 14:13 pm UTC| Commentary Economy
This fine chart from BlackRock obtained via Financial Times shows that UKs pension deficit has widened sharply after the referendum to408 billion. The incremental numbers are simply staggering.The deficit widened by...
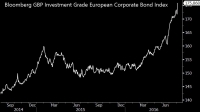
Chart of the Day: Corp Bond lies
Aug 08, 2016 16:30 pm UTC| Commentary
Inclusion of10 billion worth of corporate bonds in Bank of Englands (BoE) comprehensive package of stimulus that also includes a 25 basis points rate cut,60 billion increase in asset purchases, and100 billion worth of...
Aug 05, 2016 14:50 pm UTC| Commentary Central Banks
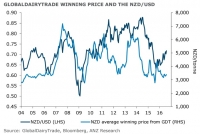
The price of dairy in global auctions has risen more than 25 percent after bottoming in late 2015. The rise has been relatively steeper this year. But since the rise, the price has dropped more than 17 percent in New...
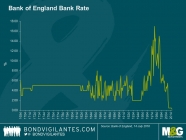
Chart of the Day: 322 year low
Aug 04, 2016 14:07 pm UTC| Commentary Central Banks
With todays rate cut from the bank of England (BoE), theinterest ratein the United Kingdom has dropped to a fresh 322 year low, as shown in this chart from bondvigilantes.com. Speculation would soon grow up for more in...
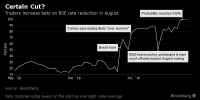
Chart of the Day: Hike probability reaches certainty
Aug 01, 2016 13:03 pm UTC| Commentary Central Banks
This chart from Bloomberg business shows that the rate cut expectations/probability from the Bank of England (BoE) has reached 100 percent, meaning that the market is certain of a rate cut this week. This means that a rate...

Chart of the Day: Policy Analyzer
Jul 29, 2016 13:32 pm UTC| Commentary Central Banks
This nice policy analyzer from John Kicklighter of Dailyfx Research explains a lot to understand, which policy adaptation might lead to which outcome. From the Neutral point as move more towards left the policy becomes...
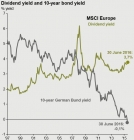
Chart of the Day: Equity looks better than bond
Jul 28, 2016 14:15 pm UTC| Commentary
This nice chart from JPMorgan fund research shows equities may be a lot cheaper in Europe, compared to the bonds. As of 30th June 2016, dividend yield in MSCI Europe is calculated at 3.7 percent, whereas10-year bund is...
- Market Data


