


 Goldman Sachs: US Dollar Likely to Stay Strong Despite Oil Price Retreat
  Gold's 365-Day EMA Streak Since Oct 2023 Faces Its First Real Test at $3,980 — Break or Bounce to $4,140?
  Today’s space race could turn fatal if we don’t agree on new rules
  AI Memory Boom Sparks Global Chip Supply Crunch
  Silver Cracks Key 365-Day EMA for First Time Since Feb 2024; Bears Eye $50 on Rallies
  Trump’s Iran Strategy: What Has Been Achieved After Three Months of Conflict?
  Gold Surges Above Key EMAs, Bulls Eye Resistance Amidst Bullish Momentum
  China’s AI Manufacturing Boom Masks Weak Consumer Economy, Citi Says
  How AI prompting turned writerly description into an everyday skill
  Sell the Bounce": Gold Rally Stalls Near $4165 as Fed Hawks Slam the Door on Rate Cuts — Targets $4000/$3600
  With Iran and the US signing a peace deal, where does that leave Benjamin Netanyahu?


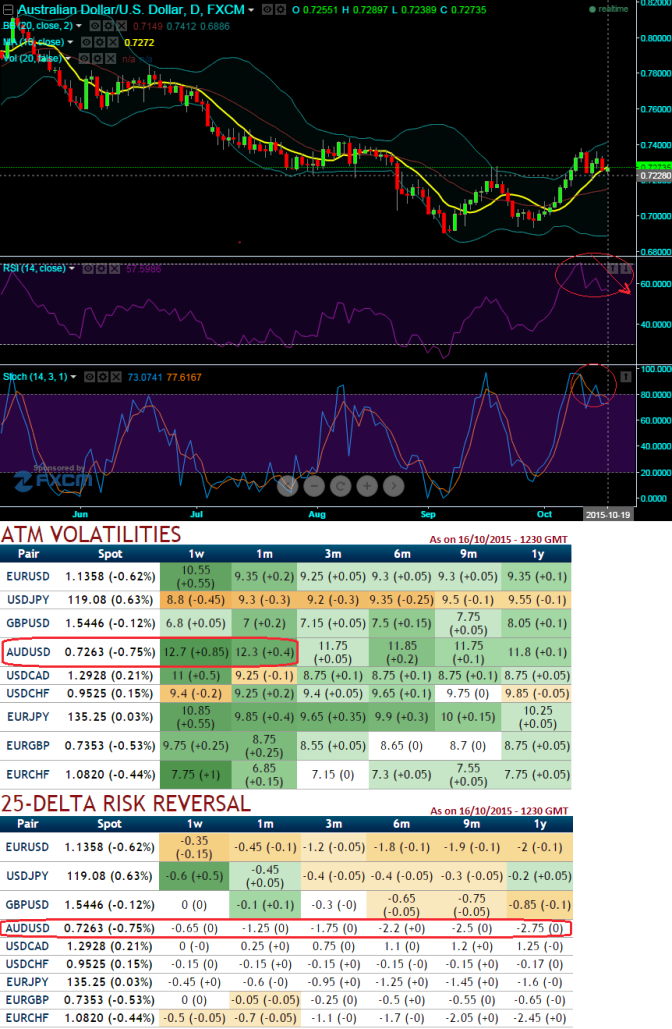
As you can observe from the diagram the implied volatility for near month at the money contracts of AUDUSD pair has been highest among G20 currency pool and is seen 12-12.5% levels for 1m expiry.
While delta risk reversal reveals where the FX market direction is heading towards and market sentiments, as a result downside hedging activity has been piling up. The OTC options market appeared to be more balanced on the direction for the pair over the 1m to 1y time horizon and as a result delta risk reversal for AUDUSD has been maintaining negative which means puts are in higher demand and overpriced comparatively.
Hence, AUDUSD's higher IV with negative delta risk reversal can be interpreted as the market reckons the price has downside potential for large movement whcih is resulting derivatives instruments for downside risks have been overpriced.
Technicals are to substantiate this stance, the RSI (14) on daily chart has reached above 70 levels which is now signaling overbought pressure. RSI's downwards convergence with massive price dips signifies bulls seem to be exhausted with their rallies.
While %D line crossover in overbought territory on slow stochastic curve is also evidencing clear selling pressures. Overall, the major trend has been downtrend dominated by the bears with clear volume confirmation.

- News

- Economy

- Central Banks
- Investing
- Research
- Roundups
- Digital Currency
- Insights
- Technical Analysis
- Technology
- Business
- Law
- Health
- Nature
- Fintech
- Science
- Topic
- Opinions
- ©Econometrics LLC . All Rights Reserved.
What do AUD/USD higher IV and 25 delta risk reversal divulge?
Monday, October 19, 2015 6:40 AM UTC
Editor's Picks


- Market Data
Most Popular


