


- News

- Economy

- Central Banks
- Investing
- Research
- Roundups
- Digital Currency
- Insights
- Technical Analysis
- Technology
- Business
- Law
- Health
- Nature
- Fintech
- Science
- Topic
- Opinions
- ©Econometrics LLC . All Rights Reserved.
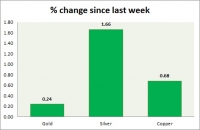
Commodities snapshot (precious & industrial)
Nov 02, 2017 13:01 pm UTC| Commentary
The metal pack is higher today. Performance this week at a glance in chart table - Gold: Gold is up today but remains downbeat compared to silver and copper. Todays range $1281-1273 Gold is currently trading at...
Nov 02, 2017 12:58 pm UTC| Commentary
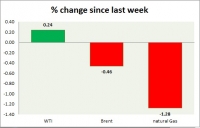
Energy pack is mixed in todays trading. Weekly performance at a glance in chart table, Oil (WTI) Oil price is down since EIA report yesterday but remains upbeat over OPEC optimism and Saudi pledge to reduce the...
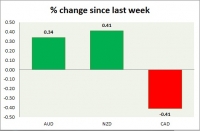
Currency snapshot (commodity pairs)
Nov 02, 2017 12:46 pm UTC| Commentary
Dollar index trading at 94.68 (+0.12%) Strength meter (today so far) Aussie +0.32%, Kiwi +0.20%, Loonie +0.21% Strength meter (since last week) Aussie +0.34%, Kiwi +0.41%, Loonie -0.41% AUD/USD Trading at...
Currency snapshot (major pairs)
Nov 02, 2017 12:36 pm UTC| Commentary
Dollar index trading at 94.66 (-0.14%) Strength meter (today so far) Euro +0.23%, Franc +0.26%, Yen +0.02%, GBP -0.93% Strength meter (since last week) Euro +0.49%, Franc -0.26%, Yen -0.47%, GBP +0.14% EUR/USD...
U.S. nonfarm payrolls likely rose in October, jobless rate to have remained stable at 4.2 pct
Nov 02, 2017 12:35 pm UTC| Commentary
Nonfarm payrolls in the U.S. are likely to have increased in October. According to a TD Economics research report, nonfarm payrolls are expected to have fully given back its hurricane-induced weakness and recorded a gain...
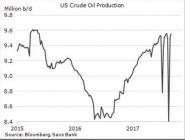
FxWirePro: Key charts explaining crude oil inventories and production report of EIA
Nov 02, 2017 12:21 pm UTC| Commentary
Here are some key charts based on data from United States Energy Information Agency (EIA) that explains the level of inventories, refinery demand, and production. Chart 1 shows crude oil production in the United...


Oil Prices Edge Higher as US-Iran Tensions and Strong Payroll Data Shape Market Sentiment

Gold and Silver Prices Slip After Strong U.S. Jobs Data, Fed Rate Cut Bets Fade

Asian Stocks Hit Record High as Strong U.S. Jobs Data Tempers Fed Rate Cut Hopes

RBA Signals Further Interest Rate Hikes if Inflation Persists, Says Governor Michele Bullock

U.S. Stock Futures Steady as Strong Jobs Data Clouds Fed Rate Cut Outlook

House Votes to End Trump’s Canada Tariff Emergency, Senate Showdown Looms

Pentagon Seeks Broader Access to AI Tools on Classified Military Networks

Trump to Host Governors at White House Amid Dispute Over Democratic Invitations

U.S. Offers Payments to Afghans in Qatar as Camp As Sayliyah Closure Nears

Angus Taylor Challenges Sussan Ley as Liberal Party Leadership Tensions Escalate

SpaceX Pivots Toward Moon City as Musk Reframes Long-Term Space Vision

SpaceX Prioritizes Moon Mission Before Mars as Starship Development Accelerates

NASA and SpaceX Target Crew-11 Undocking From ISS Amid Medical Concern

Neuralink Plans High-Volume Brain Implant Production and Fully Automated Surgery by 2026

Jared Isaacman Confirmed as NASA Administrator, Becomes 15th Leader of U.S. Space Agency
U.S. Commerce Department Reaches $252 Million Settlement With Applied Materials Over China Exports

Russia Moves to Fully Block WhatsApp as Kremlin Pushes State-Backed MAX App

Instagram CEO Defends Platform in Youth Mental Health Lawsuit Over Social Media Addiction Claims

FTC Questions Apple News Over Alleged Bias Against Conservative Media

ByteDance Advances AI Chip Development With Samsung Manufacturing Talks


- Market Data


